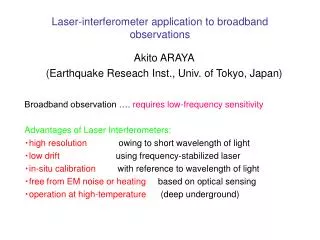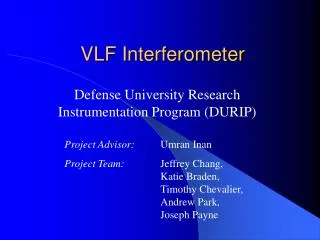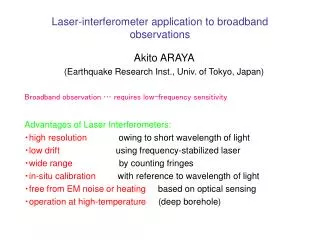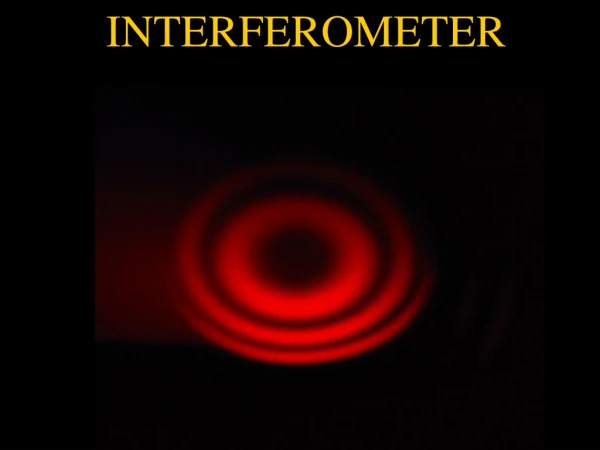
INTERFEROMETER TO MEASURE DISPERSION
INTERFEROMETER TO MEASURE DISPERSION. Michelson Interferometer response. Michelson Interferometer: sample testing. Without sample:. With sample:. sample. Ratio:. Michelson Interferometer: demonstration of a delayed response. Michelson Interferometer: sample testing.

INTERFEROMETER TO MEASURE DISPERSION
E N D
Presentation Transcript
Michelson Interferometer: sample testing Without sample: With sample: sample Ratio:
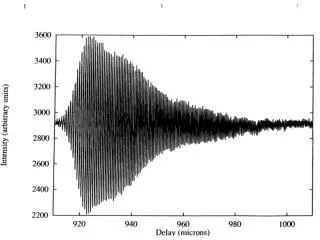
Michelson Interferometer: demonstration of a delayed response
Michelson Interferometer: sample testing Do we need short pulses? Can we test mirrors? We are measuring directly k(W) to all orders (except zero and one)
Michelson Interferometer: sample testing sample White light = random sequence of ultrashort pulses
Relative Delay (fs) 0 100 200 300 400 1.0 0.5 Normalized Intensity (a.u.) 0.0 -0.5 -1.0 0 30 60 90 120 m Relative Delay ( m) Interferogram for 2 mm of glass, spectrum and spectral phase. m m) Wavelength ( 1.2 1 0.8 0.6 5 1.0 Spectrum Phase 0 0.8 Polynomial Fit -5 Spectral Amplitude (a.u.) 0.6 Spectral Phase (rad) -10 0.4 -15 0.2 -20 0.0 -0.5 0.0 0.5 1.0 W (1/fs)
m Wavelength ( m) 1 0.9 0.8 0.7 0.6 i. ii. 1.0 1.5 0.5 Spectral Phase (rad) 1.0 0.0 0.5 -0.4 -0.2 0.0 0.2 0.4 0.6 W (1/fs) Mirror testing: Interferogram, spectrum and spectral phase. Relative Delay (fs) 0 100 200 300 1 b. Normalized Intensity (a.u.) 0 -1 0 20 40 60 80 100 m Relative Delay ( m)