ECOLOGICAL MAP
ECOLOGICAL MAP. MACROSYSTEM. EXOSYSTEM. MESOSYSTEM. MICROSYSTEM. INDIVIDUAL. VIRTUAL CHILD. INDIVIDUAL. BORN IN AFRICA MIDDLE CHILD OF THREE CHILDREN FEMALE 6 YEARS OLD CURLY HAIR, HOWEVER STRAIGHTENS IT VERY HEALTHY NO MEDICAL PROBLEMS DARK BROWN EYES 95cm TALL IN HEIGHT.

ECOLOGICAL MAP
E N D
Presentation Transcript
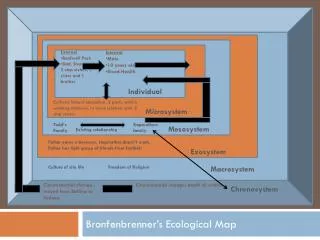
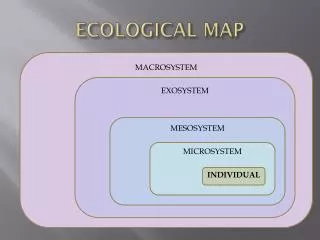
ECOLOGICAL MAP MACROSYSTEM EXOSYSTEM MESOSYSTEM MICROSYSTEM INDIVIDUAL
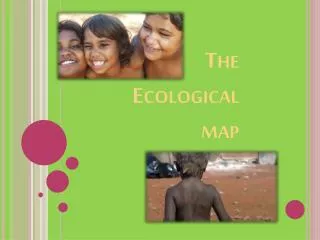
VIRTUAL CHILD INDIVIDUAL BORN IN AFRICA MIDDLE CHILD OF THREE CHILDREN FEMALE 6 YEARS OLD CURLY HAIR, HOWEVER STRAIGHTENS IT VERY HEALTHY NO MEDICAL PROBLEMS DARK BROWN EYES 95cm TALL IN HEIGHT
MICROSYSTEM“these are the settings & structures in which a child is directly involved/has a direct contact with its members.” Jennifer Bowes.(2009) “Children Families & Communities“(p.g.8) MACROSYSTEM EXOSYSTEM MESOSYSTEM MICROSYSTEM Immediate family After school care Neighbourhood play area netball School Friends & teachers INDIVIDUAL Church
MESOSYSTEM“this level refers to the interrelationships which provides a connection between two or more structures within the Microsystem” Jennifer Bowes.(2009) “Children Families & Communities“(p.g.8) MACROSYSTEM EXOSYSTEM MESOSYSTEM Extended family neighbours MICROSYSTEM teachers Church INDIVIDUAL netball friends
MESOSYSTEM MESOSYSTEM neighbours friends Extended family Church MICROSYSTEM netball teachers After school care Immediate family Neighbourhood play area School Friends & teachers INDIVIDUAL netball Church • The relationships within the mesosystem can be affected and can affect the individual themselves. • Examples of such interrelationships within the mesosystem can include: • the church organising an after school care, • neighbours joining the local netball team with the individual, • parents communicating with teachers in regards to a child’s progress • extended family going to the same local church
Exosystem“within this layer the child does not have direct any involvement with its structures, however is directly influenced by them.” Jennifer Bowes.(2009) “Children Families & Communities“(p.g.8) MACROSYSTEM EXOSYSTEM Parents work schedules Donations to the church MESOSYSTEM Friends of family MICROSYSTEM media INDIVIDUAL
EXOSYSTEM Economic recession MACROSYSTEM Local laws concerning preservation of parks & wildlife EXOSYSTEM Workplace laws & insurance policies Government support for non-profit organisations Donations to the church media Anti-discrimination laws Friends of family MESOSYSTEM Predominately Christian community neighbours friends teachers netball Increased multicultural society Extended family Parents work schedules Church • The exosystem can strongly influence an individual’s development. Although the child may not be directly involved in this layer, it does affect those structures in which he/she is involved (Mesosystem), therefore the individual child will still be able to feel the positive or negative affects of this layer. This layer can also have an further impact on the attitudes & ideaologiies of society, such as local or even national laws, etc. Examples of these effects can be seen when: • Media coverage shows a lack of Government support for non-profited organisations, such as church run after school care. • Donations are made to the shcool & church to improve facilities • parents work schedules increase in order to maintain a healthy lifestyle • friends of family members organise outings which may take the individual family away from them
MACROSYSTEM“this layer refers to the society’s values and cultural beliefs which have an influence on the child.” Jennifer Bowes.(2009) “Children Families & Communities“(p.g.9) MACROSYSTEM Local laws concerning preservation of parks & wildlife Economic recession EXOSYSTEM Anti-discrimination laws MESOSYSTEM Predominately Christian community MICROSYSTEM Increased multicultural society INDIVIDUAL Workplace laws & insurance policies
MACROSYSTEM MACROSYSTEM Economic recession Local laws concerning preservation of parks & wildlife EXOSYSTEM Anti-discrimination laws Government support for non-profit organisations Increased multicultural society Predominately Christian community Donations to the church media Friends of family Workplace laws & insurance policies Parents work schedules • Within this layer the broad cultural views and set of values within the society has an affect on the individual. These values and expectations are influenced and can strongly influence the exosystem. It does also have a strong affect on all the other layers within the ecological map. Such examples include: • Anti-discrimination laws, which allow both parents to work, regardless of their sex/race. This in tern affects all layers of the ecological map • eceonomic recession- has meant cheaper wages, hence longer working schedules (exosytem), less time spent with the individual (Microsystem) • local laws concerning the preservation of wildlife and local parks has an affect on an individual’s neighbourhood play area (microsystem).
ECOLOGICAL MAPall the layers can & do have an affect on each other and hence the individual’s development MACROSYSTEM Local laws concerning preservation of parks & wildlife Economic recession EXOSYSTEM Government support for non-profit organisations Donations to the church media Anti-discrimination laws MESOSYSTEM Extended family neighbours Predominately Christian community Friends of family MICROSYSTEM teachers Immediate family After school care Neighbourhood play area netball Increased multicultural society Church Parents work schedules School Friends & teachers INDIVIDUAL netball Church friends Workplace laws & insurance policies
INTERESTING STATISTICS • The Estimated Resident Population growth in NSW between 2001 to 2006 was 0.7%. This increase was mainly a result of an increase of births over deaths (natural increase), and an increase in migrants from overseas (net overseas migrant), rather than a result of interstate migration. It is also estimated that in 2006 25% of Australians were born overseas with 1.4% (295400 people) migrating from North Africa & the Middle East. This increase in population due to immigration has been impacted by the macrosystem. The government laws & regulations has allowed my Avatar’s family to move to Australia, and live in a society which is exposed and accepting of a wide range of different people and culture’s. Hence impacting greatly on the individual child’s development. (Australian Bureau of Statistics 2003, Population growth and distribution, 2001, cat. no. 2035.0, p. 20–22, ABS, Canberra.)
INTERESTING STATISTICS • Statistics also show that 37.9% of females between the ages of 20-39 are employed full time, and 66.5% of males between the ages of 20-39 are employed full time. This age group is classified as the Generation X & Y.. These statistics have affected my Avatar as both her parents work, and therefore have less time to spend with her or her sibblings. (Australian Bureau of Statistics (ABS) 2006, Measures of Australia's Progress, cat. no. 1370.0, p.33, ABS, Canberra.) • Generation X & Y is also the first generation to experience an increase in parental separation and divorce. 2006 statistics show that the average number of children in a household that has a couple family, with either natural or adopted children is 2.11 children. This figure is less than families who have at least one step child which is an average of 2.34 children. It also shows how many people who have already children from a previous relationship are bringing them into a new one. Although my avatars parents are still together, her kindergarten teacher has been divorced twice and is constantly addressing her past families, hence affecting the child within the microsystem layer. Also she has a few friends who have step families and has learnt to be aware of what she says around them (Australian Bureau of Statistics (ABS) 2003, ‘Changing families’ in Australian Social Trends 2003, cat. no. 4102.0, ABS, Canberra.)
INTERESTING STATISTICS • The 2006 census shows that traditional religions are decreasing, especially since the option of having no religion was put on the census. However Christianity still remains a strong religious tradition with 69% of people born in Australia and 61% of migrants classifying themselves as Christian. In 2006, 91% of people followed a Non-Christian religious groups. From those people around 66% were born overseas and around 25% had at least one overseas born parent. Statistics also show that approximately 4 out of 5 of those were born in Asia, North Africa or the Middle East. My avatar was born and had lived most of her life in Africa, moving to Australia just over a year ago. In Africa she had to be careful when expressing her faith, as Christians were mistreated, however, here in Australia she is able and encouraged to express her beliefs, especially at school and church. (The 2006 Census categorised religions according to the Australian Standard Classification of Religious Groups (ASCRG) Second Edition, 2005, cat. no. 1266.0, ABS, Canberra.)
INTERESTING STATISTICS • A 2006 Sydney case study showed that between 1971-2006 the proportion of young children (under 5 years old) has decreased from 9.6% to 6.4%.This change can be seen as the result of people living longer, and a decrease in the average amount of babies born to each woman. The total fertility rate has decreased from 2.95 babies per woman in 1971 to 1.81 babies in 2006. Also, the area in which my avatar’s family lives is Gosford, which approximately 12.9%-18.7% of families have young children This therefore has an affect on my avatar as it determines how many children there are, around her age, that she can play with. This as a result will affect her social development. (Australian Bureau of Statistics (ABS) 2007, Births, Australia, 2006, cat. no. 3301.0, ABS, Canberra.o) (ABS 2007, ‘Recent increases in Australia's fertility’ in Australian Social Trends 2007, cat. no. 4102.0, ABS, Canberra.) (ABS 2008, ‘Renter households’ in Australian Social Trends 2007, cat. no. 4102.0, ABS, Canberra.)