Introduction :
10 likes | 155 Views
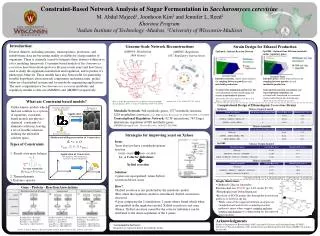
Genome-Scale Network Reconstructions. Strain Design for Ethanol Production. Introduction :. iMM904: Metabolism (904 Genes). What are Constraint based models?. Simon et al - Cell.;106(6):697-708 (2001) .

Introduction :
E N D
Presentation Transcript
Genome-Scale Network Reconstructions Strain Design for Ethanol Production Introduction: iMM904: Metabolism (904 Genes) What are Constraint based models? Simon et al - Cell.;106(6):697-708 (2001) Monica L Mo, Bernhard Palsson and Markus J Herrgård (BMC Systems Biology 2009, 3:37 doi:10.1186/1752-0509-3-37) (2009) Unlike kinetic models which find one solution to a system of equations, constraint-based models use physico-chemical constraints to eliminate solutions, leaving a set of feasible solutions defining the allowable solution space. Metabolic Network: 904 metabolic genes, 1577 metabolic reactions, 1228 metabolites (iMM904)(Mo et al - BMC Systems Biology,doi:10.1186/1752-0509-3-37 )(2009) Transcriptional Regulatory Network: 92 TF interactions, 745 Target interactions, regulation of 805 metabolic genes (iMH805) (Herrgard et al - Genome Research, 16(5):627-35)(2006) Strategies for improving yeast on Xylose Types of Constraints • Steady-state mass balance • 2. Thermodynamic • 3. Enzyme capacity v1 v2 v3 For each metabolite: ∑sij·vproduce=∑- sij·vconsume Acknowledgments Thanks to Department of Biotechnology (DBT), the Indo-US Science and Technology Forum (IUSSTF), University of Wisconsin-Madison (UW) and the Great Lakes Bioenergy Research Center (GLBRC) for making this possible. *not included in the Poster: Integration of expression data to the metabolic model. Constraint-Based Network Analysis of Sugar Fermentation in Saccharomyces cerevisiae M. Abdul Majeed1, Joonhoon Kim2 and Jennifer L. Reed2 Khorana Program 1Indian Institute of Technology -Madras, 2University of Wisconsin-Madison iMH805: Regulation (837 Regulatory Interactions) OptORF : Optimal Gene Deletion (metabolic and/or regulatory genes) Diverse datasets, including genomic, transcriptomic, proteomic, and metabolomic data are becoming readily available for a large number of organisms. There is currently a need to integrate these datasets within an in silico modeling framework. Constraint-based models of Saccharomyces cerevisiae have been developed over the past recent years and have been used to study the organisms metabolism and regulation, and to predict it’s phenotypic behavior. These models have also been useful for generating testable hypotheses about network components and interactions, predict behavior of perturbed systems and for metabolic engineering applications. The most comprehensive Saccharomyces cerevisiae metabolic and regulatory models to date are (iMM904) and (iMH805) respectively. Optknock: Optimal Reaction Deletion Identifies genes, whose removal forces the coupling between growth rate and metabolite production. Gene-protein-reaction associations and transcriptional regulations are systematically formulated as constraints and accounted for in the strain designs. Identifies reactions, whose removal forcesthe coupling between growth rate and metabolite production. To achieve the maximum growth rate the corresponding knockout mutant must also secrete a metabolite of interest. Burgard AP, Pharkya P, Maranas CD. Biotech & Bioeng. 84(6):647-657 (2003) Kim J, Reed J. L.(2009) in preparation Computational Design of EthanologenicS.cerevisiae Strains • Optknock Glucose Oxygen Limited Glucose Anaerobic Issue: Yeast does not have a transhydrogenase reaction NADH + NADP NAD + NADPH i.e. a Cofactor Imbalance Xylitol secretion Solution: 2 genes are up-regulated; when Xylitol secretion did not occur. • OptORF Glucose Oxygen Limited Glucose Anaerobic Theoretical Yield = 0.51 g ethanol/g glucose (2 mol ethanol / mol glucose) Xylose Uptake Pathway • Simple illustration: • Optknock Glucose Anaerobic • Rxn knocked out: PGCD {μ= 0.29; etoh= 87.3%} • (Phosphoglycerate Dehydrogenase) • How? • Xylitol secretion is not predicted by the metabolic model. • But, when the regulatory model is introduced, Xylitol secretion is observed. • Upon comparing the 2 simulations; 2 genes where found which when up-regulated in the regulatory model; Xylitol secretion is not seen. • Hence, Xylitol secretion caused by the cofactor imbalance can be attributed to the down-regulation of the 2 genes. Gene - Protein - Reaction Associations • Knockout of PGCD pushes flux through the downstream pathway as shown in the fig. While some of the suggested deletion strategies are straightforward and involve competing reaction pathways, many others suggest complex and non-intuitive mechanisms of compensating for the removed functionalities. Rxn(DESAT16) = Pro(OLE1) Rxn(DESAT18) = Pro(OLE1) Pro(OLE1) = Trans(OLE1) Trans(OLE1) = ORF(YGL055W) Rxn(PC) = Pro(Pyc1) or Pro(Pyc2) Pro(Pyc1) = Trans(PYC1) Pro(Pyc2) = Trans(PYC2) Trans(PYC1) = ORF(YGL062W) Trans(PYC2) = ORF(YBR218C) Rxn(ICDHxm) = Pro(Idh-m) Pro(Idh-m) = Trans(IDH1) and Trans(IDH2) Trans(IDH1) = ORF(YNL037C) Trans(IDH2) = ORF(YOR136W) Natalie C. Duarte, Markus J. Herrgård and Bernhard Ø. Palsson (Genome Res. 2004 14: 1298-1309)