Continuous random variable Normal distribution
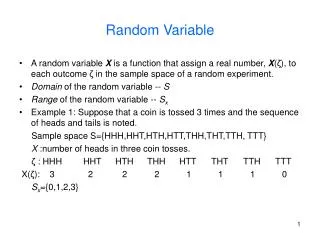
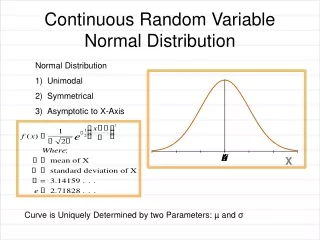
Continuous random variable Normal distribution. Overview. 5-1. Continuous random variable Normal distribution. Curve is bell shaped and symmetric. µ Score. Overview. 5-1. Figure 5-1. Continuous random variable Normal distribution. Curve is bell shaped and symmetric. µ Score.

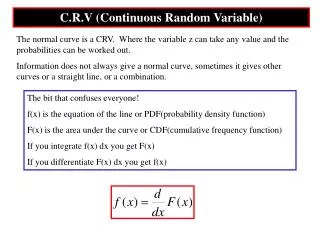
Continuous random variable Normal distribution
E N D
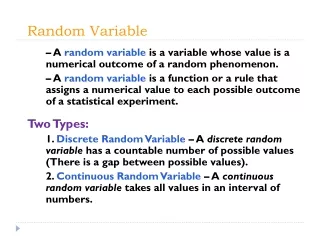
Presentation Transcript
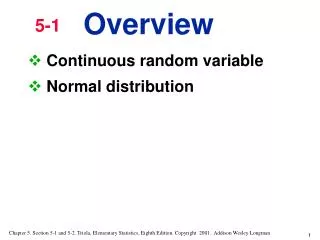
Continuous random variable Normal distribution Overview 5-1
Continuous random variable Normal distribution Curve is bell shaped and symmetric µ Score Overview 5-1 Figure 5-1
Continuous random variable Normal distribution Curve is bell shaped and symmetric µ Score Overview 5-1 Figure 5-1 x - µ2 ( ) 1 2 y = e Formula 5-1 2 p
Uniform Distribution the graph results in a rectangular shape. Density Curve(or probability density function) 1. The total area under the curve must equal 1. 2. Every point on the curve must have a vertical height that is 0 or greater. Definitions
Because the total area under the density curve is equal to 1, there is a correspondence between area and probability. Example: A fire drill must start some time between 0 and 5 hours from now, and the selection is made in such a way that all possible times are equally likely. If a time is randomly selected, what is the probability that it is during the first half hour or the last half hour?
Times in First or Last Half Hours Figure 5-3
Women: µ = 63.6 = 2.5 Heights of Adult Men and Women Men: µ = 69.0 = 2.8 63.6 69.0 Figure 5-4 Height (inches)
Standard Normal Distribution a normal probability distribution that has a mean of 0 and a standard deviation of 1 Definition
Standard Normal Distribution a normal probability distribution that has a mean of 0 and a standard deviation of 1 -3 -2 -1 0 1 2 3 Definition Area found in Table A-2 Area = 0.3413 0.4429 z = 1.58 0 Score (z ) Figure 5-6 Figure 5-5
Back left cover of text book Formulas and Tables card Appendix Table A-2
µ = 0 = 1 Table A-2 Standard Normal Distribution 0 x z
Table A-2 Standard Normal (z) Distribution z .00 .01 .02 .03 .04 .05 .06 .07 .08 .09 0.0 0.1 0.2 0.3 0.4 0.5 0.6 0.7 0.8 0.9 1.0 1.1 1.2 1.3 1.4 1.5 1.6 1.7 1.8 1.9 2.0 2.1 2.2 2.3 2.4 2.5 2.6 2.7 2.8 2.9 3.0 .0000 .0398 .0793 .1179 .1554 .1915 .2257 .2580 .2881 .3159 .3413 .3643 .3849 .4032 .4192 .4332 .4452 .4554 .4641 .4713 .4772 .4821 .4861 .4893 .4918 .4938 .4953 .4965 .4974 .4981 .4987 .0040 .0438 .0832 .1217 .1591 .1950 .2291 .2611 .2910 .3186 .3438 .3665 .3869 .4049 .4207 .4345 .4463 .4564 .4649 .4719 .4778 .4826 .4864 .4896 .4920 .4940 .4955 .4966 .4975 .4982 .4987 .0080 .0478 .0871 .1255 .1628 .1985 .2324 .2642 .2939 .3212 .3461 .3686 .3888 .4066 .4222 .4357 .4474 .4573 .4656 .4726 .4783 .4830 .4868 .4898 .4922 .4941 .4956 .4967 .4976 .4982 .4987 .0120 .0517 .0910 .1293 .1664 .2019 .2357 .2673 .2967 .3238 .3485 .3708 .3907 .4082 .4236 .4370 .4484 .4582 .4664 .4732 .4788 .4834 .4871 .4901 .4925 .4943 .4957 .4968 .4977 .4983 .4988 .0160 .0557 .0948 .1331 .1700 .2054 .2389 .2704 .2995 .3264 .3508 .3729 .3925 .4099 .4251 .4382 .4495 .4591 .4671 .4738 .4793 .4838 .4875 .4904 .4927 .4945 .4959 .4969 .4977 .4984 .4988 .0199 .0596 .0987 .1368 .1736 .2088 .2422 .2734 .3023 .3289 .3531 .3749 .3944 .4115 .4265 .4394 .4505 .4599 .4678 .4744 .4798 .4842 .4878 .4906 .4929 .4946 .4960 .4970 .4978 .4984 .4989 .0239 .0636 .1026 .1406 .1772 .2123 .2454 .2764 .3051 .3315 .3554 .3770 .3962 .4131 .4279 .4406 .4515 .4608 .4686 .4750 .4803 .4846 .4881 .4909 .4931 .4948 .4961 .4971 .4979 .4985 .4989 .0279 .0675 .1064 .1443 .1808 .2157 .2486 .2794 .3078 .3340 .3577 .3790 .3980 .4147 .4292 .4418 .4525 .4616 .4693 .4756 .4808 .4850 .4884 .4911 .4932 .4949 .4962 .4972 .4979 .4985 .4989 .0319 .0714 .1103 .1480 .1844 .2190 .2517 .2823 .3106 .3365 .3599 .3810 .3997 .4162 .4306 .4429 .4535 .4625 .4699 .4761 .4812 .4854 .4887 .4913 .4934 .4951 .4963 .4973 .4980 .4986 .4990 .0359 .0753 .1141 .1517 .1879 .2224 .2549 .2852 .3133 .3389 .3621 .3830 .4015 .4177 .4319 .4441 .4545 .4633 .4706 .4767 .4817 .4857 .4890 .4916 .4936 .4952 .4964 .4974 .4981 .4986 .4990 * *
Example: If thermometers have an average (mean) reading of 0 degrees and a standard deviation of 1 degree for freezing water and if one thermometer is randomly selected, find the probability that it reads freezing water between 0 degrees and 1.58 degrees.
Example: If thermometers have an average (mean) reading of 0 degrees and a standard deviation of 1 degree for freezing water and if one thermometer is randomly selected, find the probability that it reads freezing water between 0 degrees and 1.58 degrees. P ( 0 < x < 1.58 ) = 0 1.58
Table A-2 Standard Normal (z) Distribution z .00 .01 .02 .03 .04 .05 .06 .07 .08 .09 0.0 0.1 0.2 0.3 0.4 0.5 0.6 0.7 0.8 0.9 1.0 1.1 1.2 1.3 1.4 1.5 1.6 1.7 1.8 1.9 2.0 2.1 2.2 2.3 2.4 2.5 2.6 2.7 2.8 2.9 3.0 .0000 .0398 .0793 .1179 .1554 .1915 .2257 .2580 .2881 .3159 .3413 .3643 .3849 .4032 .4192 .4332 .4452 .4554 .4641 .4713 .4772 .4821 .4861 .4893 .4918 .4938 .4953 .4965 .4974 .4981 .4987 .0040 .0438 .0832 .1217 .1591 .1950 .2291 .2611 .2910 .3186 .3438 .3665 .3869 .4049 .4207 .4345 .4463 .4564 .4649 .4719 .4778 .4826 .4864 .4896 .4920 .4940 .4955 .4966 .4975 .4982 .4987 .0080 .0478 .0871 .1255 .1628 .1985 .2324 .2642 .2939 .3212 .3461 .3686 .3888 .4066 .4222 .4357 .4474 .4573 .4656 .4726 .4783 .4830 .4868 .4898 .4922 .4941 .4956 .4967 .4976 .4982 .4987 .0120 .0517 .0910 .1293 .1664 .2019 .2357 .2673 .2967 .3238 .3485 .3708 .3907 .4082 .4236 .4370 .4484 .4582 .4664 .4732 .4788 .4834 .4871 .4901 .4925 .4943 .4957 .4968 .4977 .4983 .4988 .0160 .0557 .0948 .1331 .1700 .2054 .2389 .2704 .2995 .3264 .3508 .3729 .3925 .4099 .4251 .4382 .4495 .4591 .4671 .4738 .4793 .4838 .4875 .4904 .4927 .4945 .4959 .4969 .4977 .4984 .4988 .0199 .0596 .0987 .1368 .1736 .2088 .2422 .2734 .3023 .3289 .3531 .3749 .3944 .4115 .4265 .4394 .4505 .4599 .4678 .4744 .4798 .4842 .4878 .4906 .4929 .4946 .4960 .4970 .4978 .4984 .4989 .0239 .0636 .1026 .1406 .1772 .2123 .2454 .2764 .3051 .3315 .3554 .3770 .3962 .4131 .4279 .4406 .4515 .4608 .4686 .4750 .4803 .4846 .4881 .4909 .4931 .4948 .4961 .4971 .4979 .4985 .4989 .0279 .0675 .1064 .1443 .1808 .2157 .2486 .2794 .3078 .3340 .3577 .3790 .3980 .4147 .4292 .4418 .4525 .4616 .4693 .4756 .4808 .4850 .4884 .4911 .4932 .4949 .4962 .4972 .4979 .4985 .4989 .0319 .0714 .1103 .1480 .1844 .2190 .2517 .2823 .3106 .3365 .3599 .3810 .3997 .4162 .4306 .4429 .4535 .4625 .4699 .4761 .4812 .4854 .4887 .4913 .4934 .4951 .4963 .4973 .4980 .4986 .4990 .0359 .0753 .1141 .1517 .1879 .2224 .2549 .2852 .3133 .3389 .3621 .3830 .4015 .4177 .4319 .4441 .4545 .4633 .4706 .4767 .4817 .4857 .4890 .4916 .4936 .4952 .4964 .4974 .4981 .4986 .4990 * *
Table A-2 Standard Normal (z) Distribution z .00 .01 .02 .03 .04 .05 .06 .07 .08 .09 0.0 0.1 0.2 0.3 0.4 0.5 0.6 0.7 0.8 0.9 1.0 1.1 1.2 1.3 1.4 1.5 1.6 1.7 1.8 1.9 2.0 2.1 2.2 2.3 2.4 2.5 2.6 2.7 2.8 2.9 3.0 .0000 .0398 .0793 .1179 .1554 .1915 .2257 .2580 .2881 .3159 .3413 .3643 .3849 .4032 .4192 .4332 .4452 .4554 .4641 .4713 .4772 .4821 .4861 .4893 .4918 .4938 .4953 .4965 .4974 .4981 .4987 .0040 .0438 .0832 .1217 .1591 .1950 .2291 .2611 .2910 .3186 .3438 .3665 .3869 .4049 .4207 .4345 .4463 .4564 .4649 .4719 .4778 .4826 .4864 .4896 .4920 .4940 .4955 .4966 .4975 .4982 .4987 .0080 .0478 .0871 .1255 .1628 .1985 .2324 .2642 .2939 .3212 .3461 .3686 .3888 .4066 .4222 .4357 .4474 .4573 .4656 .4726 .4783 .4830 .4868 .4898 .4922 .4941 .4956 .4967 .4976 .4982 .4987 .0120 .0517 .0910 .1293 .1664 .2019 .2357 .2673 .2967 .3238 .3485 .3708 .3907 .4082 .4236 .4370 .4484 .4582 .4664 .4732 .4788 .4834 .4871 .4901 .4925 .4943 .4957 .4968 .4977 .4983 .4988 .0160 .0557 .0948 .1331 .1700 .2054 .2389 .2704 .2995 .3264 .3508 .3729 .3925 .4099 .4251 .4382 .4495 .4591 .4671 .4738 .4793 .4838 .4875 .4904 .4927 .4945 .4959 .4969 .4977 .4984 .4988 .0199 .0596 .0987 .1368 .1736 .2088 .2422 .2734 .3023 .3289 .3531 .3749 .3944 .4115 .4265 .4394 .4505 .4599 .4678 .4744 .4798 .4842 .4878 .4906 .4929 .4946 .4960 .4970 .4978 .4984 .4989 .0239 .0636 .1026 .1406 .1772 .2123 .2454 .2764 .3051 .3315 .3554 .3770 .3962 .4131 .4279 .4406 .4515 .4608 .4686 .4750 .4803 .4846 .4881 .4909 .4931 .4948 .4961 .4971 .4979 .4985 .4989 .0279 .0675 .1064 .1443 .1808 .2157 .2486 .2794 .3078 .3340 .3577 .3790 .3980 .4147 .4292 .4418 .4525 .4616 .4693 .4756 .4808 .4850 .4884 .4911 .4932 .4949 .4962 .4972 .4979 .4985 .4989 .0319 .0714 .1103 .1480 .1844 .2190 .2517 .2823 .3106 .3365 .3599 .3810 .3997 .4162 .4306 .4429 .4535 .4625 .4699 .4761 .4812 .4854 .4887 .4913 .4934 .4951 .4963 .4973 .4980 .4986 .4990 .0359 .0753 .1141 .1517 .1879 .2224 .2549 .2852 .3133 .3389 .3621 .3830 .4015 .4177 .4319 .4441 .4545 .4633 .4706 .4767 .4817 .4857 .4890 .4916 .4936 .4952 .4964 .4974 .4981 .4986 .4990 * *
Example: If thermometers have an average (mean) reading of 0 degrees and a standard deviation of 1 degree for freezing water and if one thermometer is randomly selected, find the probability that it reads freezing water between 0 degrees and 1.58 degrees. Area = 0.4429 P ( 0 < x < 1.58 ) = 0.4429 0 1.58
The probability that the chosen thermometer will measure freezing water between 0 and 1.58 degrees is 0.4429. Example: If thermometers have an average (mean) reading of 0 degrees and a standard deviation of 1 degree for freezing water and if one thermometer is randomly selected, find the probability that it reads freezing water between 0 degrees and 1.58 degrees. Area = 0.4429 P ( 0 < x < 1.58 ) = 0.4429 0 1.58
NOTE: Although a z score can be negative, the area under the curve (or the corresponding probability)can never be negative. Using Symmetry to Find the Area to the Left of the Mean Because of symmetry, these areas are equal. Figure 5-7 (a) (b) 0.4925 0.4925 0 0 z = - 2.43 z = 2.43 Equal distance away from 0
The Empirical Rule Standard Normal Distribution: µ = 0 and = 1
The Empirical Rule Standard Normal Distribution: µ = 0 and = 1 68% within 1 standard deviation 34% 34% x - s x x+s
The Empirical Rule Standard Normal Distribution: µ = 0 and = 1 95% within 2 standard deviations 68% within 1 standard deviation 34% 34% 13.5% 13.5% x - 2s x - s x x+s x+2s
The Empirical Rule Standard Normal Distribution: µ = 0 and = 1 0.1% 99.7% of data are within 3 standard deviations of the mean 95% within 2 standard deviations 68% within 1 standard deviation 34% 34% 2.4% 2.4% 0.1% 13.5% 13.5% x - 3s x - 2s x - s x x+s x+2s x+3s
Finding the Area to the Right of z= 1.27 Value found in Table A-2 0.3980 This area is 0.5 - 0.3980 = 0.1020 z = 1.27 0 Figure 5-8
z .00 .01 .02 .03 .04 .05 .06 .07 .08 .09 0.0 0.1 0.2 0.3 0.4 0.5 0.6 0.7 0.8 0.9 1.0 1.1 1.2 1.3 1.4 1.5 1.6 1.7 1.8 1.9 2.0 2.1 2.2 2.3 2.4 2.5 2.6 2.7 2.8 2.9 3.0 .0000 .0398 .0793 .1179 .1554 .1915 .2257 .2580 .2881 .3159 .3413 .3643 .3849 .4032 .4192 .4332 .4452 .4554 .4641 .4713 .4772 .4821 .4861 .4893 .4918 .4938 .4953 .4965 .4974 .4981 .4987 .0040 .0438 .0832 .1217 .1591 .1950 .2291 .2611 .2910 .3186 .3438 .3665 .3869 .4049 .4207 .4345 .4463 .4564 .4649 .4719 .4778 .4826 .4864 .4896 .4920 .4940 .4955 .4966 .4975 .4982 .4987 .0080 .0478 .0871 .1255 .1628 .1985 .2324 .2642 .2939 .3212 .3461 .3686 .3888 .4066 .4222 .4357 .4474 .4573 .4656 .4726 .4783 .4830 .4868 .4898 .4922 .4941 .4956 .4967 .4976 .4982 .4987 .0120 .0517 .0910 .1293 .1664 .2019 .2357 .2673 .2967 .3238 .3485 .3708 .3907 .4082 .4236 .4370 .4484 .4582 .4664 .4732 .4788 .4834 .4871 .4901 .4925 .4943 .4957 .4968 .4977 .4983 .4988 .0160 .0557 .0948 .1331 .1700 .2054 .2389 .2704 .2995 .3264 .3508 .3729 .3925 .4099 .4251 .4382 .4495 .4591 .4671 .4738 .4793 .4838 .4875 .4904 .4927 .4945 .4959 .4969 .4977 .4984 .4988 .0199 .0596 .0987 .1368 .1736 .2088 .2422 .2734 .3023 .3289 .3531 .3749 .3944 .4115 .4265 .4394 .4505 .4599 .4678 .4744 .4798 .4842 .4878 .4906 .4929 .4946 .4960 .4970 .4978 .4984 .4989 .0239 .0636 .1026 .1406 .1772 .2123 .2454 .2764 .3051 .3315 .3554 .3770 .3962 .4131 .4279 .4406 .4515 .4608 .4686 .4750 .4803 .4846 .4881 .4909 .4931 .4948 .4961 .4971 .4979 .4985 .4989 .0279 .0675 .1064 .1443 .1808 .2157 .2486 .2794 .3078 .3340 .3577 .3790 .3980 .4147 .4292 .4418 .4525 .4616 .4693 .4756 .4808 .4850 .4884 .4911 .4932 .4949 .4962 .4972 .4979 .4985 .4989 .0319 .0714 .1103 .1480 .1844 .2190 .2517 .2823 .3106 .3365 .3599 .3810 .3997 .4162 .4306 .4429 .4535 .4625 .4699 .4761 .4812 .4854 .4887 .4913 .4934 .4951 .4963 .4973 .4980 .4986 .4990
Finding the Area Between z= 1.20 and z = 2.30 0.4893 (from Table A-2 with z = 2.30) Area A is 0.4893 - 0.3849 = 0.1044 0.3849 A z= 1.20 z= 2.30 0 Figure 5-9
z .00 .01 .02 .03 .04 .05 .06 .07 .08 .09 0.0 0.1 0.2 0.3 0.4 0.5 0.6 0.7 0.8 0.9 1.0 1.1 1.2 1.3 1.4 1.5 1.6 1.7 1.8 1.9 2.0 2.1 2.2 2.3 2.4 2.5 2.6 2.7 2.8 2.9 3.0 .0000 .0398 .0793 .1179 .1554 .1915 .2257 .2580 .2881 .3159 .3413 .3643 .3849 .4032 .4192 .4332 .4452 .4554 .4641 .4713 .4772 .4821 .4861 .4893 .4918 .4938 .4953 .4965 .4974 .4981 .4987 .0040 .0438 .0832 .1217 .1591 .1950 .2291 .2611 .2910 .3186 .3438 .3665 .3869 .4049 .4207 .4345 .4463 .4564 .4649 .4719 .4778 .4826 .4864 .4896 .4920 .4940 .4955 .4966 .4975 .4982 .4987 .0080 .0478 .0871 .1255 .1628 .1985 .2324 .2642 .2939 .3212 .3461 .3686 .3888 .4066 .4222 .4357 .4474 .4573 .4656 .4726 .4783 .4830 .4868 .4898 .4922 .4941 .4956 .4967 .4976 .4982 .4987 .0120 .0517 .0910 .1293 .1664 .2019 .2357 .2673 .2967 .3238 .3485 .3708 .3907 .4082 .4236 .4370 .4484 .4582 .4664 .4732 .4788 .4834 .4871 .4901 .4925 .4943 .4957 .4968 .4977 .4983 .4988 .0160 .0557 .0948 .1331 .1700 .2054 .2389 .2704 .2995 .3264 .3508 .3729 .3925 .4099 .4251 .4382 .4495 .4591 .4671 .4738 .4793 .4838 .4875 .4904 .4927 .4945 .4959 .4969 .4977 .4984 .4988 .0199 .0596 .0987 .1368 .1736 .2088 .2422 .2734 .3023 .3289 .3531 .3749 .3944 .4115 .4265 .4394 .4505 .4599 .4678 .4744 .4798 .4842 .4878 .4906 .4929 .4946 .4960 .4970 .4978 .4984 .4989 .0239 .0636 .1026 .1406 .1772 .2123 .2454 .2764 .3051 .3315 .3554 .3770 .3962 .4131 .4279 .4406 .4515 .4608 .4686 .4750 .4803 .4846 .4881 .4909 .4931 .4948 .4961 .4971 .4979 .4985 .4989 .0279 .0675 .1064 .1443 .1808 .2157 .2486 .2794 .3078 .3340 .3577 .3790 .3980 .4147 .4292 .4418 .4525 .4616 .4693 .4756 .4808 .4850 .4884 .4911 .4932 .4949 .4962 .4972 .4979 .4985 .4989 .0319 .0714 .1103 .1480 .1844 .2190 .2517 .2823 .3106 .3365 .3599 .3810 .3997 .4162 .4306 .4429 .4535 .4625 .4699 .4761 .4812 .4854 .4887 .4913 .4934 .4951 .4963 .4973 .4980 .4986 .4990
P(a < z < b) denotes the probability that the z score is between a and b P(z > a) denotes the probability that the z score is greater than a P (z < a) denotes the probability that the z score is less than a Notation
Figure 5-10 Interpreting Area Correctly Subtract from 0.5 ‘greater than x’ ‘at least x’ ‘more than x’ ‘not less than x’ Add to 0.5 0.5 x x
Figure 5-10 Interpreting Area Correctly Subtract from 0.5 ‘greater than x’ ‘at least x’ ‘more than x’ ‘not less than x’ Add to 0.5 0.5 x x Add to 0.5 ‘less than x’ ‘at most x’ ‘no more than x’ ‘not greater than x’ Subtract from 0.5 0.5 x x
Figure 5-10 Interpreting Area Correctly Subtract from 0.5 ‘greater than x’ ‘at least x’ ‘more than x’ ‘not less than x’ Add to 0.5 0.5 x x Add to 0.5 ‘less than x’ ‘at most x’ ‘no more than x’ ‘not greater than x’ Subtract from 0.5 0.5 x x Add C Use A = C - B ‘between x1 and x2’ A B x1 x2 x1 x2
Example: Temperature readings are normally distributed with mean = 0 and standard deviation =1. Find the temperature separating the bottom 95% form the top 5% Find the temperature corresponding to the 95th percentile
Finding z Scores when Given Probabilities 95% 5% 5% or 0.05 0.45 0.50 z 0 ( z score will be positive ) FIGURE 5-11 Finding the 95th Percentile
z .00 .01 .02 .03 .04 .05 .06 .07 .08 .09 0.0 0.1 0.2 0.3 0.4 0.5 0.6 0.7 0.8 0.9 1.0 1.1 1.2 1.3 1.4 1.5 1.6 1.7 1.8 1.9 2.0 2.1 2.2 2.3 2.4 2.5 2.6 2.7 2.8 2.9 3.0 .0000 .0398 .0793 .1179 .1554 .1915 .2257 .2580 .2881 .3159 .3413 .3643 .3849 .4032 .4192 .4332 .4452 .4554 .4641 .4713 .4772 .4821 .4861 .4893 .4918 .4938 .4953 .4965 .4974 .4981 .4987 .0040 .0438 .0832 .1217 .1591 .1950 .2291 .2611 .2910 .3186 .3438 .3665 .3869 .4049 .4207 .4345 .4463 .4564 .4649 .4719 .4778 .4826 .4864 .4896 .4920 .4940 .4955 .4966 .4975 .4982 .4987 .0080 .0478 .0871 .1255 .1628 .1985 .2324 .2642 .2939 .3212 .3461 .3686 .3888 .4066 .4222 .4357 .4474 .4573 .4656 .4726 .4783 .4830 .4868 .4898 .4922 .4941 .4956 .4967 .4976 .4982 .4987 .0120 .0517 .0910 .1293 .1664 .2019 .2357 .2673 .2967 .3238 .3485 .3708 .3907 .4082 .4236 .4370 .4484 .4582 .4664 .4732 .4788 .4834 .4871 .4901 .4925 .4943 .4957 .4968 .4977 .4983 .4988 .0160 .0557 .0948 .1331 .1700 .2054 .2389 .2704 .2995 .3264 .3508 .3729 .3925 .4099 .4251 .4382 .4495 .4591 .4671 .4738 .4793 .4838 .4875 .4904 .4927 .4945 .4959 .4969 .4977 .4984 .4988 .0199 .0596 .0987 .1368 .1736 .2088 .2422 .2734 .3023 .3289 .3531 .3749 .3944 .4115 .4265 .4394 .4505 .4599 .4678 .4744 .4798 .4842 .4878 .4906 .4929 .4946 .4960 .4970 .4978 .4984 .4989 .0239 .0636 .1026 .1406 .1772 .2123 .2454 .2764 .3051 .3315 .3554 .3770 .3962 .4131 .4279 .4406 .4515 .4608 .4686 .4750 .4803 .4846 .4881 .4909 .4931 .4948 .4961 .4971 .4979 .4985 .4989 .0279 .0675 .1064 .1443 .1808 .2157 .2486 .2794 .3078 .3340 .3577 .3790 .3980 .4147 .4292 .4418 .4525 .4616 .4693 .4756 .4808 .4850 .4884 .4911 .4932 .4949 .4962 .4972 .4979 .4985 .4989 .0319 .0714 .1103 .1480 .1844 .2190 .2517 .2823 .3106 .3365 .3599 .3810 .3997 .4162 .4306 .4429 .4535 .4625 .4699 .4761 .4812 .4854 .4887 .4913 .4934 .4951 .4963 .4973 .4980 .4986 .4990
Finding z Scores when Given Probabilities 95% 5% 5% or 0.05 0.45 0.50 1.645 0 (z score will be positive) FIGURE 5-11 Finding the 95th Percentile
Example: Temperature readings are normally distributed with mean = 0 and standard deviation =1. Find the temperature separating the bottom 10% form the top 90% Find the temperature corresponding to the 10th percentile
Finding z Scores when Given Probabilities 90% 10% Bottom 10% 0.10 0.40 z 0 (zscore will be negative) FIGURE 5-12 Finding the 10th Percentile
z .00 .01 .02 .03 .04 .05 .06 .07 .08 .09 0.0 0.1 0.2 0.3 0.4 0.5 0.6 0.7 0.8 0.9 1.0 1.1 1.2 1.3 1.4 1.5 1.6 1.7 1.8 1.9 2.0 2.1 2.2 2.3 2.4 2.5 2.6 2.7 2.8 2.9 3.0 .0000 .0398 .0793 .1179 .1554 .1915 .2257 .2580 .2881 .3159 .3413 .3643 .3849 .4032 .4192 .4332 .4452 .4554 .4641 .4713 .4772 .4821 .4861 .4893 .4918 .4938 .4953 .4965 .4974 .4981 .4987 .0040 .0438 .0832 .1217 .1591 .1950 .2291 .2611 .2910 .3186 .3438 .3665 .3869 .4049 .4207 .4345 .4463 .4564 .4649 .4719 .4778 .4826 .4864 .4896 .4920 .4940 .4955 .4966 .4975 .4982 .4987 .0080 .0478 .0871 .1255 .1628 .1985 .2324 .2642 .2939 .3212 .3461 .3686 .3888 .4066 .4222 .4357 .4474 .4573 .4656 .4726 .4783 .4830 .4868 .4898 .4922 .4941 .4956 .4967 .4976 .4982 .4987 .0120 .0517 .0910 .1293 .1664 .2019 .2357 .2673 .2967 .3238 .3485 .3708 .3907 .4082 .4236 .4370 .4484 .4582 .4664 .4732 .4788 .4834 .4871 .4901 .4925 .4943 .4957 .4968 .4977 .4983 .4988 .0160 .0557 .0948 .1331 .1700 .2054 .2389 .2704 .2995 .3264 .3508 .3729 .3925 .4099 .4251 .4382 .4495 .4591 .4671 .4738 .4793 .4838 .4875 .4904 .4927 .4945 .4959 .4969 .4977 .4984 .4988 .0199 .0596 .0987 .1368 .1736 .2088 .2422 .2734 .3023 .3289 .3531 .3749 .3944 .4115 .4265 .4394 .4505 .4599 .4678 .4744 .4798 .4842 .4878 .4906 .4929 .4946 .4960 .4970 .4978 .4984 .4989 .0239 .0636 .1026 .1406 .1772 .2123 .2454 .2764 .3051 .3315 .3554 .3770 .3962 .4131 .4279 .4406 .4515 .4608 .4686 .4750 .4803 .4846 .4881 .4909 .4931 .4948 .4961 .4971 .4979 .4985 .4989 .0279 .0675 .1064 .1443 .1808 .2157 .2486 .2794 .3078 .3340 .3577 .3790 .3980 .4147 .4292 .4418 .4525 .4616 .4693 .4756 .4808 .4850 .4884 .4911 .4932 .4949 .4962 .4972 .4979 .4985 .4989 .0319 .0714 .1103 .1480 .1844 .2190 .2517 .2823 .3106 .3365 .3599 .3810 .3997 .4162 .4306 .4429 .4535 .4625 .4699 .4761 .4812 .4854 .4887 .4913 .4934 .4951 .4963 .4973 .4980 .4986 .4990
Finding z Scores when Given Probabilities 90% 10% Bottom 10% 0.10 0.40 -1.28 0 (zscore will be negative) FIGURE 5-12 Finding the 10th Percentile