Download

1 / 19
210 likes | 366 Views
Monitoring changes in soil moisture during artificial infiltration with geophysical methods. Derek Lichtner 1 , Jonathan Nyquist 1 , Laura Toran 1 , Li Guo 2 , and Henry Lin 2 (1) Earth and Environmental Science, Temple University, Philadelphia, PA 19122

E N D
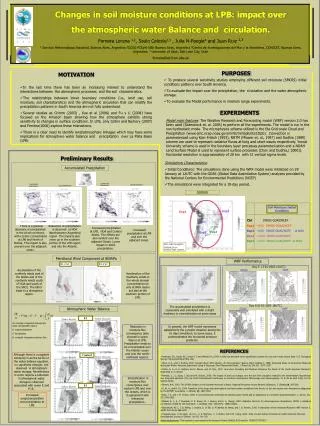
Monitoring changes in soil moisture during artificial infiltration with geophysical methods Derek Lichtner1, Jonathan Nyquist1, Laura Toran1, Li Guo2, and Henry Lin2 (1) Earth and Environmental Science, Temple University, Philadelphia, PA 19122 (2) Crop and Soil Sciences, Penn State University, University Park, PA 16802 From Lin, 2010. Funding was provided by NSF EAR-0725019 for the Susquehanna/Shale Hills Critical Zone Observatory and the Temple CST URP
Flow in the Vadose Zone Important for: • Making agricultural decisions • Understanding contaminant propagation • Describing groundwater recharge • Understanding soil formation The Critical Zone Vadose zone Unconfined Aquifer
Susquehanna Shale Hills CZO • 7.9-ha forested research site in Huntingdon County, PA • Ephemeral stream runs roughly east to west • Weikert series soil: a well-drained, shallow soil
Geophysical Methods • Surface reflection GPr • Ground wave GPR • Electrical resistivity tomography
Artificial Infiltration Experiments Infiltration • 53 L or 26.5 L of water at constant head • Horizontal flow • Geophysical data were collected at 15 minute intervals
Ground-Penetrating Radar (GPR) • GPR images: • Reflective interfaces with contrasting dielectric permittivities, e.g. soil layers, moisture • Scattering objects, e.g. rocks, tree roots Tx Rx GPR signal trace Two-way travel time Reflective interfaces 800 MHz, 1 GHz, and 2.3 GHz antennas were used
GPR Data Processing Strong reflectors (weathered shale) Heterogeneous soil/root fabric Software: • MatLab scripting • MatGPRopensource add-on • Reflex2DQuick • Surfer 11 Gridding Example radargram of Weikert soil site, pre-infiltration
New Approach: Surface Reflection GPR • GPR unit is elevated • Increased reflection amplitudes where the soil is moist • Water content is proportional to the surface reflection coefficient • Travel time proportional to microtopography Tx Rx Tx Rx Elevated GPR unit Stronger surface reflections air wet soil dry soil
Microtopography from off-ground GPR Subsurface flow followed this topography Position, N to S (m) Position, W to E (m) • Relative elevations determined from off-ground GPR travel times • 5 cm contour interval
Time-lapse GPR Surface Amplitude (%) (%) (%) (%) 1. At end of 26.5 L (7 gal) injection 3. 45 minutes after injection ended 2. 15 minutes after injection ended 4. At end of additional 26.5 L (7 gal) injection • Perspective is overhead map view • Blue = percent increases in soil moisture, orange = background • Water appears rapidly and subsequently fades
Another Approach: Ground Wave GPR Tx Rx air wave air ground wave critically refracted wave reflected wave layer ε1 refracted wave layer ε2 Propagation paths of GPR waves in soils. After Huisman et al., 2003. • Air wave arrives first • Ground wave arrives second • Water content is proportional to the difference in arrival times • Lower velocity ground waves indicate higher moisture content
Ground Wave Delay due to Moisture Unwetted Trace: Wetted Trace: Normalized Amplitude Normalized Amplitude • Left: Unwetted GPR signal trace is very reproducible • Right: Ground wave in wetted soil shows delay and amplitude increase Time (ns) Time (ns) After wetting: Ground wave delay Before After Before After
Ground Wave Arrival Time Picking Air wave echo Slow ground wave = moist soil Air wave Distance (m) Time (ns) • Air wave (top red line) and ground wave arrivals (bottom red line) • Ground wave velocity is dependent on moisture
Time-lapse Soil Water Content Large increases at grid’s center fade with time 2nd infiltration more to E with microtopography Change in Water Content (m3/m3) Position, W to E (m) Trench Map view Time-lapse water contents calculated with ground wave GPR Ground wave line Soil grid
Electrical Resistivity • Super Sting R8 Resistivity meter with 28 electrodes • Changes in resistivity are proportional to changes in saturation battery voltmeter V subsurface with apparent resistivity ρ equipotential lines electric field lines
Time-lapse Resistivity Trench Position, W to E (m) Conductive anomaly from water Water promotes near-surface current, creating positive inversion artifact Depth (m) Anomaly fades slightly with time, spreads Depth (m) Greater extent after 2nd infiltration Depth (m) • Negative percent-changes in resistivity (blue) correspond to increases in soil moisture • Increased water contents appear quickly and subsequently fade, indicating rapid infiltration At end of 53 L injection 30 minutes after injection ended At end of additional 53 L injection
Off-Ground GPR Conclusions • Infiltration followed the site’s microtopography to the S and SE • Infiltration was rapid, with geophysical signatures strongest at the conclusion of injection and fading with each subsequent 15 minute measurement Ground Wave GPR Resistivity • A second infiltration pulse utilized already activated flowpaths Questions? At end of 53 L injection 30 minutes after injection ended At end of additional 53 L injection