Download
1 / 24
240 likes | 256 Views
This study focuses on improving soil moisture variability modeling in CLM 3.5 by incorporating the water table concept and adjusting parameters. Results show enhanced simulation accuracy matching observations in Illinois and Brazil. Recommendations for model calibration and further improvements are outlined for future work.

E N D
Improved Soil Moisture Variability in CLM 3.5 Sean Swenson NCAR Advanced Study Program in collaboration with Keith Oleson and David Lawrence
Outline • Simulating soil moisture in Illinois with validation by Illinois State Water Survey observations. • Simulation of a site in Brazil (ABRACOS). • Incorporating the water table into the soil water equations. • Recommendations. • Current and Future work.
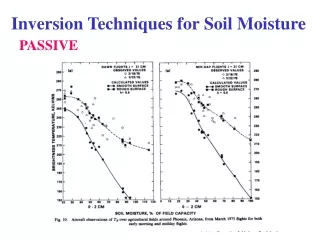
Water table is not apparent in observed soil moisture data. Red: shallowest layer Blue: deepest layer •Control shows most variability at depth. •Observations show most variability near the surface.
Decreasing the f parameter (Q e(-f·z)) causes equilibrium baseflow to occur at greater depth, pushing the water table below 2 meters. Variability is roughly uniform with depth.
Decreasing the saturatedhydraulic conductivity by an order of magnitude reproduces the phase lag with depth. This increases variability, especially near the surface.
Insolation is increased by 10% to match climatological values from other studies. This is likely due to the linear interpolation currently used, which results in a poor diurnal cycle.
The upper 10 cm of the observations exhibit anomalously wet conditions during the winter. This can be modeled by a “compacted” layer by increasing the ratio of clay to sand. This increases field capacity and decreases infiltration, further increasing variability near the surface.
Finally, increasing Leaf Area Index (LAI) to 4 boosts transpiration. The final simulation shows similar variability that is consistent with the observations in both amplitude, phase, and depthdependence. The water table in this simulation is at a depth of about 3.5 meters.
Outline • Simulating soil moisture in Illinois with validation by Illinois State Water Survey observations. • Simulation of a site in Brazil (ABRACOS). • Incorporating the water table into the soil water equations. • Recommendations. • Current and Future work.
Other sites: Brazil/ABRACOS/Reserva Jaru Forest Flux Tower Control shows high soil wetness due to shallow water table. New simulation is also wet, but due to high infiltration rates. Water table is much deeper, 6-8 meters.
Outline • Simulating soil moisture in Illinois with validation by Illinois State Water Survey observations. • Simulation of a site in Brazil (ABRACOS). • Incorporating the water table into the soil water equations. • Recommendations. • Current and Future work.
The current water table formulation can exhibit pathological behavior. The hydraulic conductivity used in the QCHARGE calculation is too low. During drying events, the water table fails to track the saturated contours. Using a hydraulic conductivity based on the average soil moisture between the water table and the layer above it causes the water table to better track the saturated contours.
“Fixing” the QCHARGE calculation reveals a second problem. The “two-step” aquifer formulation decouples the flux of water from the soil column to the aquifer. This can result in unrealistic drying at depth. Incorporating the water table as the lower boundary condition in the soil water equations leads to a consistent QCHARGE calculation, and eliminates these drying events.
Outline • Simulating soil moisture in Illinois with validation by Illinois State Water Survey observations. • Simulation of a site in Brazil (ABRACOS). • Incorporating the water table into the soil water equations. • Recommendations. • Current and Future work.
Summary & Recommendations CLM 3.5 is demonstrated to possess the ability to simulate soil moisture observations with great detail. Significant improvements to the simulation of soil moisture variability in CLM 3.5 can be obtained by a model formulation change combined with parameter calibration: • Incorporate the exchange of water between the soil column and the aquifer (QCHARGE) into the soil water equations. • Correct the hydraulic conductivity used to compute QCHARGE. • Deepen the water table, by adjusting parameters controlling baseflow. • Re-examine the values of saturated hydraulic conductivity (KSAT).
Outline • Simulating soil moisture in Illinois with validation by Illinois State Water Survey observations. • Simulation of a site in Brazil (ABRACOS). • Incorporating the water table into the soil water equations. • Recommendations. • Current and Future work.
Current and Future Work • Model calibration: • are global parameter values adequate? • can regional parameter values be determined? • what is the appropriate ratio of surface runoff to baseflow? • deepening the water table will further reduce surface runoff. • Model validation: • use combined constraints of GRACE and river discharge. • use flux tower observations. • obtain additional soil moisture and well level observations.
Deepening the Water Table • f versus rtop_max (q ~ rtop_maxexp(-fzwt): • both deepen the water table by increasing drainage for a given depth • decreasing f dampens the variability, increasing rtop_max does not
Deepening the Water Table • f versus rtop_max (q ~ rtop_maxexp(-fzwt): • both deepen the water table by increasing drainage for a given depth • decreasing f dampens the variability, increasing rtop_max does not
Partitioning Runoff • in the topmodel formulation, surface runoff is a function of water table depth • deepening the water table will further decrease surface runoff, and increase baseflow