Thailand as an Example
640 likes | 660 Views
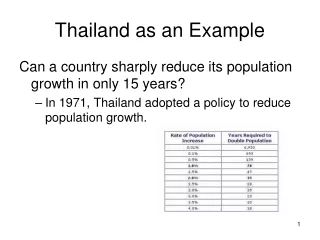
Thailand as an Example. Can a country sharply reduce its population growth in only 15 years? In 1971, Thailand adopted a policy to reduce population growth. Thailand (cont). Several reasons account for this impressive feat:

Thailand as an Example
E N D
Presentation Transcript
Thailand as an Example Can a country sharply reduce its population growth in only 15 years? • In 1971, Thailand adopted a policy to reduce population growth.
Thailand (cont) Several reasons account for this impressive feat: • the creativity of the government-supported family planning program • the high literacy rate among women (90%) • an increasing economic role for women and advances in women's rights • better health care for mothers and children • the openness of the Thai people to new ideas • the willingness of the government to encourage and financially support family planning and to work with the private nonprofit Population and Community Development Association (PCDA)(http://www.pda.or.th/eng/project_aids.htm) • support of family planning by the country's religious leaders (95% of Thais are Buddhist)
How is Population Size Affected by Birth and Death Rates? Populations grow or decline through the interplay of three factors: • births • deaths • migration
Demographic Birth & Death Rates • Crude Birth Rate (CBR) - the number of live births per 1000 people in a population in a given year. • Crude Death Rate (CDR) - the number of deaths per 1000 people in a population in a given year.
Crude Birth Rates(CBR) • annual number of live births per 1000 population. • It is "crude" because it relates births to total population without regard to the age or sex composition of that population.
Crude Birth Rate (cont) The crude birth rate of a country is strongly influenced by; • age structure of population • sex structure of population • customs & family size expectations • adopted population policies
Lowering Crude Birth Rates China's Way • In 1965 Chairman Mao stated an ever larger population was "a good thing," when China's CBR was 37 per 1000 and its population was 540 million. • In 1976 population reached 852 million although the CBR declined to 25.
China's Way (cont) "One couple, one child" became the slogan in 1979 backed by both incentives and penalties. • late marriages were encouraged
China's Way (cont) Single child families received: • free contraceptives • cash awards • abortions • sterilization
China's Way (cont) Penalties included: • steep fines for second births • sterilization of husband or wife of families with more than one child Penalties resulted in: • Infanticide
China's Way (cont) • Prosperous Urbanites • Successful Population Controls • Population Projections
China's Way (cont) Falling fertility rates will result in: • declining proportion of working-age people • inadequate number of people to care for rapidly growing number of senior citizens.
Factors Affecting Birth Rates Religious • Roman Catholics and Muslims Political • Italy • European governments
Crude Death Rate (CDR) • Crude Death Rate (CDR) - the number of deaths per 1000 people in a population in a given year.
World Birth/Death Rate Trend • Birth rates and death rates are coming down worldwide, but death rates have fallen more sharply.
World Population Change Rate expressed as a percentage: Annual rate of Birth rate - Death rate natural population = -------------------------------- change (%) 10
World Population Change (cont) • Exponential growth • World annual population growth rate • Actual Population change
Population Number by Country • China (1.33 billion in 2010) and • India (1.2 billion in 2011) make up 37% of the world's population. • US (312 million as of 12/7/2011) has the world's third largest population but only 4.6% of the world's people.
Total Fertility Rate (TFR) • More refined that the crude birth rate. • Shows the rate of reproduction among fertile females 15 – 49 years old. • CBR the denominator includes the entire population including males and females not of reproductive age.
Population Projections • UN population projections to 2050 vary depending on the world's projected average TFR. • Next slide: UN population projections to 2050
Factors Affecting Birth Rates and Fertility Rates • Importance of children as a part of the labor force. • Urbanization. • Cost of raising and educating children. • Educational and employment opportunities for women. • Infant mortality rate. • Average age at marriage • Availability of private and public pension systems. • Religious beliefs, traditions and cultural norms. • Availability of legal abortions. • Availability of reliable birth control methods.
Demographic Transition As countries become industrialized, first their death rates and then their birth rates decline in four steps: • Pre-Industrial Stage • Transitional Stage • Industrial Stage • Post-Industrial Stage
Indicators of Overall Health • Two useful indicators of overall health of people in a country or region are: • life expectancy - the average number of years a newborn infant can expect to live • infant mortality rate - the number of babies out of 1000 born who die before their first birthday
Hans Rosling • Swedish medical doctor, academic, statistician and public speaker • http://www.youtube.com/watch?v=jbkSRLYSojo&feature=player_embedded
Demographic Transition As countries become industrialized, first their death rates and then their birth rates decline in four steps: • Pre-Industrial Stage • Transitional Stage • Industrial Stage • Post-Industrial Stage
How Does Age Structure Affect Population Growth? • Any country with many people below 15 years old (represented by a wide based population structure diagram) has a powerful built-in momentum to increase its population size unless death rates rise sharply.
How Can Age Structure Diagrams Be Used To Make Population and Economic Projections?