Download
1 / 29
290 likes | 300 Views
Explore the 2014 US-China agreement on reducing carbon emissions, implications for global climate, carbon pricing, risks, and needed actions for mitigation and adaptation. Includes economic analyses and recommendations from the Stern Report.

E N D
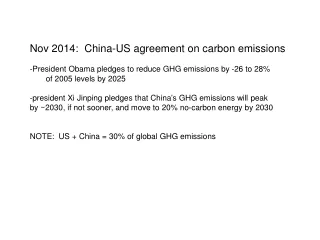
Nov 2014: China-US agreement on carbon emissions • President Obama pledges to reduce GHG emissions by -26 to 28% • of 2005 levels by 2025 • president Xi Jinping pledges that China’s GHG emissions will peak • by ~2030, if not sooner, and move to 20% no-carbon energy by 2030 • NOTE: US + China = 30% of global GHG emissions
Relevant carbon prices as of Jan 15, 2015 relative to Nov 15, 2014 http://californiacarbon.info/wp-content/uploads/2015/01/California-and-the-Carbon-World-Jan-2015.pdf
carbon “taxes” cap and trade & S. Korea effective 1/1/15 http://californiacarbon.info/wp-content/uploads/2015/01/California-and-the-Carbon-World-Jan-2015.pdf
http://ec.europa.eu/clima/policies/g-gas/documentation_en.htm#Reportshttp://ec.europa.eu/clima/policies/g-gas/documentation_en.htm#Reports
http://theenergycollective.com/trevorhouser/245991/ neck-and-neck-us-and-european-ghg-emissions-trends
http://theenergycollective.com/trevorhouser/245991/ neck-and-neck-us-and-european-ghg-emissions-trends
Contributions to emissions changes in the EU http://ec.europa.eu/clima/policies/g-gas/ documentation_en.htm#Reports renewables energy efficiency economic growth
Risk = probability of outcome x severity of its consequences Costs of carbon mitigation? vs Costs of adaptation? HOW DO WE MINIMIZE RISK?
Risk = probability of outcome x severity of its consequences “tail” risk = low-probability event w/ potentially catastrophic impacts
Climate Risks are Regional
3 areas of action to minimize climate risk: • change business practice to become • more resilient • 2) investor adaptation (SEC issued guidance • on climate disclosure; only 40% of S&P • companies voluntarily participate) • 3) public sector response – investments and • policies that can reduce GHG emissions
When combine high-tail risks w/ catastrophic costs, any cost-benefit analysis (CBA) of climate change mitigation vs. adaptation is dominated by so-called “fat tail” risk. e.g. Weitzman, Martin L. 2009. On modeling and interpreting the economics of catastrophic climate change. Review of Economics and Statistics 91(1): 1-19.
The Stern Review: The Economics of Climate Change commissioned by UK Prime Minister & Chancellor in 2006 • Some Stern numbers: • the timeframe for most of their economic analyses • 550ppm the CO2 target level of stabilization • 5-20% range of costs to world output associated with climate change • comment: relatively pessimistic view of consequences • -1 to 5% range of costs associated with stabilizing CO2 at 550ppm • comment: relatively optimistic view of mitigation • $85 cost of one ton of CO2 in Business as Usual (BAU) • $25-35 cost of one ton of CO2 for 550ppm stabilization
Total cost of climate change in BAU scenario over next two centuries: • -5% of global per capita consumption • however, this 5% number does not take into account: • “non-market” impacts (how do you value human health and environmental • impacts?) • positive feedbacks in the climate system (such as???) • disproportionate impact of climate change on world’s poor (equity) • Including these factors could bring the cost of climate change to -20%!
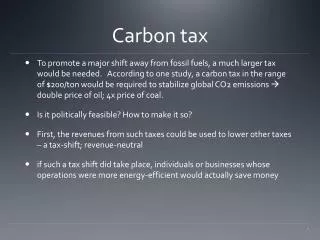
What action is needed, according to Stern: • Mitigation: • Carbon pricing (tax or trading) • Technology policy (spur development of low-C energy) • Remove barriers to behavioral change (enforce changes where • economic incentives are not strong enough) • Adaptation: • Improve climate information; esp. regional climate forecasts • Land-use and building planning (infrastructure decisions) • Natural resource protection, coastal protection, etc • Financial safety net for poorest members of society • The Stern Report urgently calls for coordinated, international action, • justified by cost-benefit analysis of climate risks (costs of -5 to -20%) • balanced against mitigation (costs of -1 to -5%).
www.c2es.org • - run a “top-down” climate policy – economic impact model • (limitations, assumptions, inputs?) • for a doubling of GHG (to 560ppm), benefits of • mitigation $55-140billion (0.5-2% GDP) • cost of mitigation 0.2-1.5% GDP ($25-200/ton of carbon) How do we interpret a “price on carbon”?
McKINSEY GLOBALABATEMENT CURVE