Download
1 / 27
280 likes | 427 Views
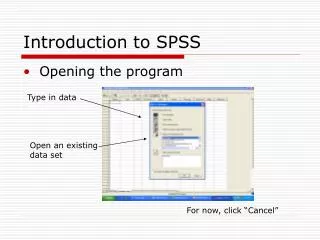
Introduction to SPSS 16.0 Part 2. Kevin Schoepp. Outline. Running an analysis- explore differences, t test, ANOVA Creating charts/graphs Edit Tables Moving charts and graphs into Word. Find differences between groups. 1. Click Analyze- Descriptive Stats- Explore.

E N D
Introduction to SPSS 16.0Part 2 Kevin Schoepp
Outline • Running an analysis- explore differences, t test, ANOVA • Creating charts/graphs • Edit Tables • Moving charts and graphs into Word
Find differences between groups 1. Click Analyze- Descriptive Stats- Explore 2. Move a scale variable to dependent, move the category variable to factor- click Statistics
Find differences between groups 3. Select Descriptors- click continue- click Plots 4. Select the following- click Continue
Find differences between groups 5. Click OK The results will appear
Running Analyses (t- test) 6. Click Analyze- Compare Means- Independent Samples t test 7. Select the test variable and the grouping variable, then click Define Groups
Running Analyses (t- test) 8. Label the groups (in this case f or m) 9. Select OK
Running Analyses (t- test) The results will appear
Running Analyses (ANOVA) 10. Click Analyze- Compare Means- One-Way ANOVA 11. Move the Numerical variable to the dependent list and move the categorical variable to the Factor list
Running Analyses (ANOVA) 12. Click Options 13. Select Descriptive then Continue- then select PostHoc…
Running Analyses (ANOVA) 14. Select Tukey then Continue 15. Click OK
Running Analyses (ANOVA) Results will appear The stars tell you where the significant differences occur
Creating Charts The simplest way to make a chart is to create it as you are running an analysis (not always possible) 16. Click Descriptive Stats- Frequencies 17. Move the correct variables to the right side and then click Charts
Creating Charts 18. Select the appropriate options and then click continue 19. Click OK
Creating Charts The chart will appear in the output window 20. Double click the chart to open the chart editor
Creating Charts You get edit options by double clicking on an item. The changes are automatically added to the output page once you close the chart editor
Table Edit 21. Right click on any table- select SPSS Pivot Table Object- Open 22. In the Pivot table window, click Table looks
Table Edit 23. Select the Table look you like and then click OK 24. Double click any item to further alter it within the Pivot table window
Table Edit 25. Click Format- Table Properties to further alter the table 26. Click the appropriate tab and make changes as desired Close the Pivot Table when done and all changes will appear in the output
Table Edit With a Pivot Table Open, you can hide any unwanted columns or rows 27. Use Ctrl + Alt + click to select the row or column to be hidden 28. Right click on the column or row and click hide category
Table Edit The data is hidden but not gone 29. Within the Pivot Table, click Edit- Undo Hide to make the data visible again
Export Charts and Graphs to Word The steps for charts and graphs are the same. 30. Right click on the chart and select copy. 31. In the correct location in the Word document, right click and select paste.
Export Charts and Graphs to Word The chart will appear in an editable format in the document.
Export Charts and Graphs to Word 32. To edit a pasted graph, right click the graph and click Edit Picture.
Table Edit- Set Default Table • Activate a pivot table (double-click anywhere in the table). • From the menus choose: • Format TableLooks… • Select a TableLook from the list and click Edit Look. • Adjust the table properties for the attributes that you want. • Click Save Look or Save As to save the TableLook and click OK. • Deselect the pivot table. • From the menus choose: • Edit Options… • Click the Pivot Tables tab. • Select the TableLook from the list and click OK.
Creating Charts (Chart Builder) Charts can be built using Chart Builder Refer to the SPSS Tutorial- Chart Creation Basics for step-by-step guidance
Resources • Texas A & M- a huge selection of helpful movies http://www.stat.tamu.edu/spss.php • UCLA- SPSS 12.0 Starter Kit (useful movies, FAQs, etc) http://www.ats.ucla.edu/stat/spss/sk/default.htm • Indiana University- Getting Started (useful instructions with screenshots) http://www.indiana.edu/~statmath/stat/spss/win/ • University of Toronto- A Brief Tutorial (screenshots, instructions and basic stats) http://www.psych.utoronto.ca/courses/c1/spss/page1.htm • Central Michigan- Tutorials and Clips (movies, screenshots, instructions- slow loading but good) http://calcnet.mth.cmich.edu/org/spss/toc.htm • SPSS Statistics Coach and Tutorial (under Help) as well as the ZU library • Online Statistics Textbook http://www.statsoft.com/textbook/stathome.html