Introduction to SPSS
660 likes | 1.18k Views
Introduction to SPSS. Allen Risley Academic Technology Services, CSUSM arisley@csusm.edu 750-4169. SPSS Workshop Agenda. Layout of the Program Adding Data to SPSS Preparing Data for Analysis Creating New Variables Descriptive Data Analysis Working with SPSS Output.

Introduction to SPSS
E N D
Presentation Transcript
Introduction to SPSS Allen Risley Academic Technology Services, CSUSM arisley@csusm.edu 750-4169
SPSS Workshop Agenda • Layout of the Program • Adding Data to SPSS • Preparing Data for Analysis • Creating New Variables • Descriptive Data Analysis • Working with SPSS Output
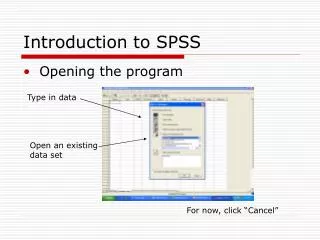
Layout of the SPSS Program • SPSS Program Windows • Menus and Toolbars • SPSS Options
SPSS Program Windows • SPSS Program Windows • Data Editor • Data View • Variable View • Output Viewer • Syntax Editor • File Types • Data: filename.sav • Output: filename.spo • Commands: filename.sps • Menus and Toolbars
SPSS Options • Users can set options to make program easier to use • Edit menu • Choose Options • OnGeneralTab: • Display Names & File • h Record Syntax… & Temp. Dir. • H:\ • OnViewerTab: • h Display Commands in the Log
More SPSS Options • Output LabelsTab • For Pivot Table Labeling: • Variables in labels shown as Names and Labels • Variable values in labels shown as Values and Labels • Pivot tables Tab • For Tablelook: • Choose Academic (narrow).tlo
Adding Data to SPSS • Use Syntax to Read an Existing Data File • In-line Data in a Syntax File • The SPSS Text Import Wizard • Data Entry in the SPSS Data Editor • Import from Excel
Loading Data Using Text Wizard • The SPSS Text Import Wizard: • File Menu: • Read Text Data • In Open Data box, enter: C:\SPSS\grades.txt • Step 1: choose No, Next • Step 2: choose Fixed Width, No, Next • Step 3: use defaults: Next • Step 4: use defaults: Next
Loading Data Using Text Wizard • The SPSS Text Import Wizard: • Step 5: Use these names and formats: • V1: ID, Numeric • V2: Gender, String • V3: Test1, Numeric • V4: Test2, Numeric • V5: Test3, Numeric • Click on Next
Loading Data Using Text Wizard • The SPSS Text Import Wizard: • Step 6: choose No, Yes • The Yes will open a syntax window with the text of a GET DATA command • Click on Finish • In the Syntax window choose the RunMenu • ChooseAll • This creates an SPSS data file with the contents of grades.txt
Loading Data Using Syntax • You can re-use a syntax file by opening it and running it • File menu • Open • Syntax… • You can open a blank syntax window to type in your own commands • File menu • New • Syntax…
Other Ways to Load Data • Data Entry in the SPSS Data Editor • Import from Excel • File Menu: • Open • Data • In Open Data box, enter: C:\SPSS\grades.xls • Click OK for defaults
Preparing Data for Analysis • Variable Formats • Variable Labels • Value Labels • Missing Values • Copying Data Properties
Formatting Your Variables • Variable Formats • Click on the Variable View tab of the Data Editor to edit or display formats • Name• Type • Width • Decimals • Label • Values • Missing• Columns• Align • Measure • Variable Labels – • Type in descriptive text that explains what the variable measures
Formatting Your Variables (cont.) • Value Labels – Text that explains what numeric values stand for • Click in the cell of the Value column for your variable, enter a Value and Label, click Add • Missing Values – Defines values that should not be included in calculations • Click in the cell of the Missing column for the variable, choose either Discrete… or Range… and enter the values
Creating New Variables • Collapsing Variables Using Recode • Computing Variables • Counting Values in Other Variables • Ranking Cases • Date and Time Variables
Recoding Variables • Recoding renumbers or collapses the values of a variable • Transform menu • Recode into different variables • Highlight variable(s) and move over with arrow • Fill in a Name and Label for the new variable • Click Old and New Values
Recoding Variables • Specify the Old Value • e.g., 90 through 100, 80 through 89, etc. • Specify a New Value • e.g., 4 (for an A), 3(for a B), etc. • Click on the Add button • Repeat until all old and new values are specified • Old values can be defined as single values, ranges or missing values • Add value and variable labels, etc.
Computing New Variables • Create new variables using equations or functions • Transform menu • Compute Variable • Enter a Target Variable Name – e.g. TestAvg • Build a Numeric Expression • E.g. – (Test1 + Test2 + Test3)/3 • Click OK
Other Ways to Create Variables • Counting Values in Other Variables • Ranking Cases • Date and Time Variables
Descriptive Data Analysis • FREQUENCIES • DESCRIPTIVES • CROSSTABS • MEANS
The FREQUENCIES Procedure • FREQUENCIES creates tables with counts of cases for each value of the variable • Analyze Menu: • Descriptive Statistics… • Frequencies • Highlight variablesto create tables, click the arrowto add to variable list, then click OK • Statistics, Chart and Format options are available
FREQUENCIES Output • Command syntax • Summary statistics • Variable values and corresponding labels • Frequency counts for each value • Percentages • Raw percent • Valid percents • Cumulative percents
The DESCRIPTIVES Procedure • DESCRIPTIVES creates tables with summaries of values for variables • Analyze Menu: • Descriptive Statistics… • Descriptives • Highlight variables to create tables, click the arrow to add to variable list, then click OK • Options are available to choose different statistics
DESCRIPTIVES Output • Command syntax • Variable name and label • Number of cases • Statistics: • Minimum • Maximum • Mean • Standard Deviation
The CROSSTABS Procedure • CROSSTABS displays the intersection of values of two or more variables • Analyze Menu: • Descriptive Statistics… • Crosstabs • Highlight variablesto create tables, click the arrowto add to Row, Column or Layer variable lists, then click OK • Statistics, Cells and Format options are available
Crosstabs Output • Table title • Column variables • Row variables • Cell counts (# of cases) • Column percents (% of cases in column) • Statistics
The MEANS Procedure • MEANS calculates overall means and group means (defined by independent variables) • Analyze Menu: • Descriptive Statistics… • Means • Highlight variablesto create tables, click the arrowto add to Dependent or Independent variable lists, then click OK • Optional Statistics are available
MEANS Output • Command syntax • Numbers of cases included and excluded • Dependent variable • Independent (group) variable • Means • Number of cases • Standard Deviations
Working with SPSS Output • Editing/Manipulating Tables • Exporting Output to a File • Copying and Pasting Output
Editing SPSS Tables • SPSS Table objects can be opened for editing before you use them elsewhere • Right-click on the table • SPSS Pivot Table Object • Either Edit or Open • Text can be formatted, rows or columns removed, footnotes added, etc.
Exporting SPSS Output to a File • SPSS output can be exported to other programs • Either entire output file, or selected tables • Export to Word, HTML, Excel, Text, PDF, or PowerPoint
Copying and Pasting SPSS Output • To copy and paste SPSS tables from SPSS to Word: • Right-click on the table • Choose Copy • Switch to Word • Click location in the document • Choose Paste Special • Choose Picture
On-line SPSS Resources at CSUSM • Academic Technology Services is developing on-line resources for help with SPSS. Visit our SPSS page at: • http://courses.csusm.edu/resources/spss/ • E-mail Allen Risley at: arisley@csusm.edu