Download
1 / 16
160 likes | 254 Views
Explore the global landscape of world stocks with advances in DNA technology for stock-level differentiation. Addressing the issue of Illegal, Unreported, and Unregulated (IUU) fishing through the development of new genetic markers. Discover the impact of IUU on fisheries worldwide and the need for enforceable traceability systems. Uncover the prevalence of fraud in fish products and the importance of robust traceability for consumer protection. Learn about DNA barcoding and SNP markers for species identification and genetic traceability. Embrace the future of fish stock management with innovative technologies and methodologies.

E N D
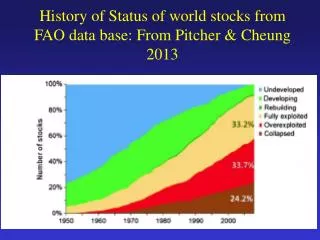
History of Status of world stocks from FAO data base: From Pitcher & Cheung 2013
Advances in technologyPrimary tool 1: genetic markers circle = distinguishable stocklevel yellow and red populations cannot be distinguished with traditional markers at hand Solution: develop new markers thatallowdistinction and areeasilytransferablebetweenlaboratories
A major problem- we do not really know what we are catching- IUU Illegal, Unreported and Unregulated (IUU) fishing- ($15bn-23$bn per year + biodiversity loss (c. Globally 20-30% IUU) Need for unequivocal evidence of fraud/illegal activity!!
IUU Discards Peruvian anchoveta Pelagic fish Groundfish Invertebrates Global Impact of IUU we don’t know the catches of global fisheries…estimates of 25% global IUU
IUU IN EUROPE BALTIC SEA Cod 35-40% Herring 35% N SEA Cod 50% All spp up to 66% CELTIC-BISCAY SHELF Cod 35-60% ALL AREAS Higher risk spp. Incl. sharks up to 75% Legal loophole- can under declare by 35% without risk of punishment IBERIAN COASTAL Tuna 40% Modified from estimates provided by Ian Dickie (2009) –(Economics for the Environment Consultancy)- Chatham House Presentation MEDITERRANEAN Tuna and swordfish 40-50%
Impact of IUU in Europe Estimated total cost to EU Member States from 2008-2020 of lost catches: • c. € 10.7 billion • > 27,800 lost jobs in fishing and processing • Costs to sustainability • Costs to ecosystem • A need for legally enforceable traceability system to tackle IUU and for consumer protection both at species and population levels
Imports and fish fraud • EC imports (80% of fish consumed) - IUU products are estimated at $ 1.6 billion annually (Oceanic Development Study, 2007) • Ireland study: Fish fraud and fish substitution (from retail outlets): 25% cod and haddock products mislabelled;- 82% smoked fish mislabelled • Bangor study: 386 white fish – major UK supermarket chains. Mislabelling ~ 5.6% (4 billion fish products consumed in UK per year = ~ 200 million products!) • Eco-labelling and potential fraud
The need – robust & legally enforceable traceability system What?? Where from? FORK TO FISH OCEAN
DNA Technology Species level • Established scientific approach • FISHBOL, TRACEFISH, FISH and CHIPS, LABELFISH • Multiple analysis options • Further development of logistics and infrastructure needed Geographic origin level • New area of research / novel approach • FishPopTraceSNP markers (neutral & non-neutral) • Transfer of R&D required • Development of logistics and infrastructure needed
Fresh • Frozen • Dried • Salted • Canned • Cooked DNA & Sample Types • Whole fish • Part fish • Trace sample • Product • Boiled • Fried • Baked etc. • Mixed Species • Mixed Fish
What is DNA barcoding? - a short DNA sequence, from a uniform locality on the genome used for identifying species http://barcoding.si.edu http://www.barcodinglife.org
SNPs (gene associated markers) and genetic traceability • Highly abundant (1 SNP/500-1000 bp) • Easy to interpret (binary code) • Ideal for archiving (reference data bases) • Adaptable to high-throughput (genomics) • Methods easily transferred among laboratories • Suitable for degraded DNA samples
Uptake- field sampling (port, market etc) USB stick can sequence DNA in seconds
Single-species testing in the field TWISTFLOW® RED SNAPPER | RELEASED FRIDAY 29th NOVEMBER 2013