Download
1 / 19
190 likes | 464 Views
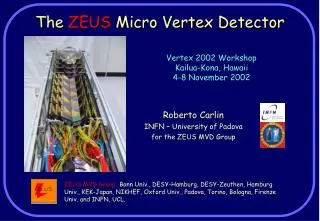
ZEUS silicon vertex detector DAQ and slow control systems. Chris Youngman DESY. Outline. The ZEUS Silicon Micro Vertex Detector ZEUS Experiment Environment and Requirements DAQ Description Slow Control Description Software Summary and Outlook. Detector Layout. Forward Section 410 mm.

E N D
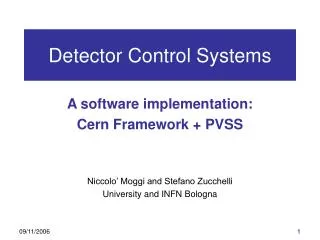
ZEUS silicon vertex detector DAQ and slow control systems Chris Youngman DESY C. Youngman
Outline • The ZEUS Silicon Micro Vertex Detector • ZEUS Experiment Environment and Requirements • DAQ Description • Slow Control Description • Software • Summary and Outlook C. Youngman
Detector Layout Forward Section 410 mm Barrel Section 622 mm e± p 27.5 GeV 920 GeV The forward section consists of 4 wheels with 28 wedged silicon sensors/layer providing r- information. ~150 mm Single sided 300 μm thick silicon 20 μm strip and 120μm readout pitch ~200k channels The Barrel section provides 3 layers of support frames (ladders) which hold 5 full modules, 600 square sensors in total, providing r- and r-z space points. C. Youngman
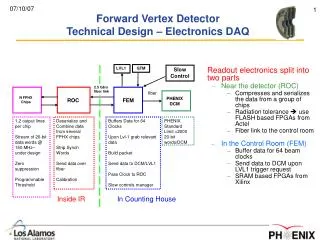
The ZEUS Detector 107 Hz CAL Front End CTD Front End Other Components CAL FLT CTD FLT p 5s pipeline 5s pipeline Global First Level Trigger ~0.7 s 920 GeV GSLT Accept/Reject 500Hz e± Other Components CAL SLT CTD SLT Event Buffers Event Buffers ~10 ms 27.5 GeV Global Second Level Trigger GSLT Accept/Reject 40Hz CAL CTD Event Builder Third Level Trigger HERA bunch crossing interval: 96 ns cpu cpu cpu cpu cpu cpu ZEUS: 3-Level Trigger System (Rate 500Hz505 Hz) 5Hz Offline Tape C. Youngman
MVD DAQ and Trigger Design • ZEUS experiment designed end of the ’80s • First high rate (96 ns) pipelined system • With a flexible 3 level trigger • Main building blocks were transputers (20 MHz,20Mbit/s) • 10 years later the MVD: • 200.000 analog channels (more than the whole of ZEUS) • MVD available for triggering from 2nd level trigger on • DAQ Design Choice: • Use off-the-shelf products whenever possible • VME embedded systems for readout • Commercial Fast/Ethernet Gigabit Network • Linux PC for data processing C. Youngman
125 mm 64 mm Detector Front-end Front-end Chip HELIX 3.0* • 128 channel 136 cell deep analog pipelined readout designed for HERA-B VXD • Highly programmable for wide and flexible usage (Test pulse..) • Expected and see S/N ~ 13 • Data readout multiplexed failsafe token chain (MVD: 8 chips = 1024 channels) • Serial analog output (3m) to amplifier then (15m) to ADC. * Uni. Heidelberg Nim A447, 89 (2000) Front-end Hybrid Silicon Sensors z rØ Barrel 1/2 module Helix hybrid C. Youngman
The ADC Modules Custom made ADC Boards* • 9u VME board + private bus extensions • Eight 20 MHz ADC (each receiving 1 Token chain) • 10 bit resolution • Common Mode, Pedestal and Noise Subtraction • Strip Clustering, threshold cuts, etc. • 2 separate data buffers: • cluster data (for trigger purposes) • raw/strip data for accepted events. • Design data sizes • Max. raw data size: 1.5 MB event (~208.000 ch) • Strip data: Noise threshold 3 sigma (~15 KB) • Cluster data: ~ 4 KB * Kek Tokyo Nim A436,281 (1999) ~30 boards in 3 crates C. Youngman
First Level Trigger Synchronization Clock and Control Master board* • For synchronization to the ZEUS GFLT • Standalone operation provided • Handles: Accept/Abort, FLT+Bunch Crossing Numbers Trigger Type, Readout Type, Test Triggers BUSY, ERROR, F-Error Slave Board • One Slave board per ADC crate • Initiate Helix readout of ADC on GFLT accept • Non accepted triggers role off Helix pipeline Helix Interface Fan-out and driver boards • Helix Front-end programming • Pipeline synchronization and readout * ZEUS UCL http://www.hep.ucl.ac.uk/zeus/mvd/candc.html Run Control C. Youngman
VME Data Readout and Transfer • Data readout and transfer using LynxOS 3.01 Real Time OS on network booted Motorola MVME2400/MV2700 PPC VME Computers • VME functionalities using developed VME driver/library uvmelib*: multiuser VME access, contiguous memory mapping and DMA transfers, VME interrupt handling and process synchronization • System interrupt driven (data transfer on last ADC data ready) • Readout Cluster data and send (TCPIP) to "free" processing GTT • On receiving GSLT decision (TCPIP) • Readout Strip data on "accept" and send (TCPIP) to Event Builder • Priority scheduling of interrupt, readout and send task pipeline required • Real Time kernel → LynxOS • Otherwise readout-transfer latency unstable 1 CPU per ADC crate C. Youngman
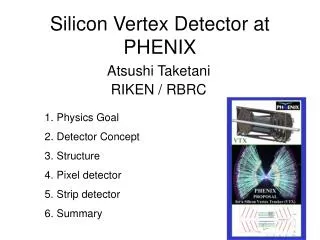
HELIX Driver Front-end The MVD Data Acquisition System and GTT Forward Tracking, Straw Tube Tracker Read-out Central Tracking Detector Read-out Analog Data MVD HELIX Front-End & Patch-Boxes Global First Level Trigger,Busy, Error MVD VME Readout NIM + Latency AnalogLinks AnalogLinks AnalogLinks NIM + Latency NIM + Latency NIM + Latency NIM + Latency Clock + Control Clock+ Control Clock+ Control Lynx OS CPU Lynx OS CPU Lynx OS CPU Lynx OS CPU Lynx OS CPU ADCM modules ADCM modules ADCM modules Lynx OS CPU CTD 2TP modules STT 2TP module VME (C+C Slave) Crate 2 (MVD forward) VME (C+C Slave) Crate 1 (MVD bottom) VME (C+C Master) Crate 0 (MVD top) VME TP connection Data from CTD VME TP connection Data from STT VME HELIX Driver Crate NIM + Latency Lynx OS CPU GSLT 2TP modules GTT Control + Fan-out Global Tracking Trigger Processors (GFLT rate) TP connection to the Global Second Level Trigger ZEUS Run Control and Online Monitoring Environment Global Second Level Trigger Decision Fast Ethernet/ Gigabit Network NIM + Latency Lynx OS CPU Slow control + Latency Clock modules VME CPU Boot Server and Control Main MVDDAQ server, Local Control, Event-Builder Interface Network Connection to the ZEUS Event Builder C. Youngman
Mean GTT latency at GSLT vs GFLT rate per run Hz Low data occupancy rate tests Monte Carlo data HERA data DAQ performance • Remember MVD SLT = GTT • Latency of SLT trigger OK • Within envelope of CTD SLT • Tail acceptable • GFLT Rate • OK, but max ~ 400 Hz • More work needed * http://mvddaq.desy.de ms C. Youngman
MVD Slow Control CANbus is the principle fieldbus: Use 3 ESD CAN-PCI/331* dual CANbus adapters in Linux PC Each SC sub-system uses a dedicated CANbus: • Silicon detector/radiation monitor bias voltage: • 412 channels of HV (per Si half module) • 30 ISEG EHQ F0025p 16 channel supply boards** • Output: V < +200V, I < 0.5mA, ΔV = 5mV, Vnom = 60V • Readout: ΔV = 5mV, ΔI = 10nA • 4 ISEG ECH 238L UPS 6U EURO crates** • Front-end Hybrid low voltage: Custom implementation based on the ZEUS LPS detector supplies (INFN TO) • 206 pairs of +2/-2V, I < 1mA (per front-end Helix hybrid) • 48 supplies in 6 6U EURO crates • Patchbox power supply: additional 1 crate 8 boards. *http://www.esd-electronics.com **http://www.iseg-hv.com C. Youngman
MVD Slow Control • Hybrid water cooling: • Custom implementation using FREON/Water circuits • Cooling performance 1.1kW (2mW per Helix channel) • Control and monitoring of T, P, H, dry air flow • Internal PLC SPI bus interfaced via NIKHEF SPICAN* • Hybrid and beampipe temperature monitoring: • Based on NIKHEF SPICAN* • 90 (18 beampipe and 72 hybrid) NTC sensors • Range 0<T<100ºC, Cooling on: Barrel 18º, Wheel 23º • Safety interlock • Ensures MVD OFF during injection or over temperature. • Frenzel+Berg** EASY-30 SPS. Monitors 4 bi-metal temperature and 1 hybrid cooling relays.Turns HV and LV supplies off if any relay open. • CERN BBL3 interlock control. MVD slow control signals interfaced to ZEUS experiment interlock. *http://www.nikhef.nl/user/n48/zeus_doc.html **//www.frenzel-berg.de/produkte/easy.html C. Youngman
Software issues • Standard C software used throughout, but: • Rewrote LynxOS VME driver to exploit TUNDRA chipset • ROOT used for GUI's (Run Control, Slow Control, histogram display, etc.) • Multi-threaded when needed • Web browser access to configuration, status and summary information* • Hosts • VME LynxOS systems network booted • Linux PCs disk booted • Executables, etc. mounted via NFS • Boot started Daemon process starts-stops advertised processes • Process communications • Single XDR definition file used • Single TCP HUB processes: • Allocates unique name on client request • Permanent or temporary messaage forwarding based on name, XDR message type and MD5 hash • Most recent message (name, type, hash) stored * http://mvddaq.desy.de C. Youngman
Run Control • Operation modes: • Standalone use ROOT GUI • In ZEUS use Gateway process and GUI viewer • Configuration: • Run defined by Run type (PHYSICS, DAQTEST), Trigger type (STD-PHYSICS, RATE-TEST) Run number • CPP used to sequence list of processes + input variables • Process execution: • Process control starts-stops process via daemons • Pedestal, time scan and charge injection runs done by shiftcrew Run Control GUI Histogram Display GUI C. Youngman
Slow Control • Slow Control Controller process • Simplified process control • Sequences transitions to: • ON • OFF • STANDBY • By sending configuration to each sub-system • Interfaces to BBL3 experiment interlock disables trigger if in wrong state • Each sub-system • Handles CANbus traffic: • Control commands • Monitoring • Emergency messages • Performs transitions required • Produces monitoring histograms, etc • Flags errors Slow Control GUI Cooling Control GUI C. Youngman
Data Quality Monitoring • Detector performance stored in offline mySQL accessible database • Needed for offline data analysis • Useful for tracking time dependencies: bad channels, etc. C. Youngman
MVD on data First running experience • 2002 running HERA after lumi upgrade compromized by high background rates • Sept 2002 runs used to shakedown system • Cluster data size cuts required before GTT latency acceptable. • Nov 2002 - Feb 2003 luminosity running • Offline analysis underway • Tracking software available • Alignment corrections started • Kº seen C. Youngman
Summary and Outlook • The MVD and GTT system have been integrated into the ZEUS experiment • 267 runs with 3.1Mio events recorded between 31/10/02 and 18/02/03 with MVD on and DQM (~ 700 nb-1) • The MVD DAQ and GTT architecture, built as a synthesis of custom solutions and Common off the shelf equipment (real Time OS + Linux PC+ Gigabit Network) has turned out as an reasonable choice • The MVD DAQ and GTT performance (latency, stability and efficiency) are acceptable Encouraging results, but need period of stable luminosity data taking The shutdown ends in June 2003... has the background improved ? C. Youngman