Download
1 / 45
470 likes | 927 Views
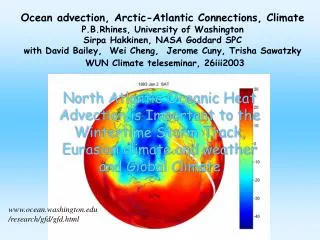
Tropical Cyclone – Ocean Interaction in Oceanic Frontal Regions. GS Extension. Gulf Stream (GS). Hurricane Bill (2009). Seunghyon Lee GSO/URI 08/26/11. [NOAA satellite image] . 1. Intro. . Significance of the Study. Gulf Stream. Kuroshio. Intense TCs. [ wikipedia ].

E N D
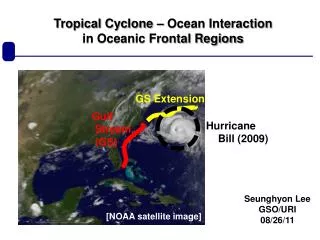
Tropical Cyclone – Ocean Interaction in Oceanic Frontal Regions GS Extension Gulf Stream(GS) Hurricane Bill (2009) Seunghyon Lee GSO/URI 08/26/11 [NOAA satellite image]
1. Intro. Significance of the Study Gulf Stream Kuroshio Intense TCs [wikipedia]
Statement of the Problem • Tropical Cyclone (TC) – ocean interactions in the vicinity of oceanic fronts such as the Gulf Stream and Kuroshio ? Ocean response “In addition to near-inertial, sub-inertial ocean responses to TCs may be significant due to the gradient of potential vorticity (PV).” Feedback to TC σ < f “TC-induced sea surface cooling may depend not only on TC parameters but also on the frontal advection and cross-frontal gradient of ocean heat content.”
Overview • Chap. 1. Observation and simulation of topographic Rossby waves generated by the passage of Super Typhoon Songda in the East China Sea • Chap. 2.Simulation of oceanic frontal meandering induced by tropical cyclones • Chap. 3.Simulations of sea surface cooling induced by tropical cyclones in oceanic frontal region
First Chapter Observation and simulation of topographic Rossby waves (TRWs) generated by the passage of Super Typhoon Songdain the East China Sea Objective Investigation of sub-inertial bottom-intensified signals observed after the passage of Typhoon Songda (2004)
1. Intro. 1. TRW generation due to typhoon Songda • East China Sea (ECS) • Kuroshio current • Acoustic Doppler current profiler (ADCP) Topography of the East China Sea & the track of Typhoon Songda
1. Intro. 1. TRW generation due to typhoon Songda Typhoon passage Energetic bottom-trapped signal 1.5-day low-pass filtered velocity vectors observed
N m^{-2} 1. TRW generation due to typhoon Songda • Princeton Ocean Model (POM) - realistic setting (1/12° grid spacing, 26 sigma levels, topography less smoothed in the ECS) • Ocean Initial data : T& Sdata from the Global Ocean Data Assimilation Experiment • Wind forcing : approximated based on best-track typhoon data, using the method in the GFDL/URI coupled hurricane-ocean model.
1. Intro. 1. TRW generation due to typhoon Songda • Analysis of observed & simulated signals in terms of topographic-Rossby-wave (TRW) characteristics • Frequency analysis : wavelet transform • Principal-axis analysis : θp : major-axis direction (-π≤ 2θp≤π) • Wavenumber analysis : least-squares fit to theoretical vertical profile (Rhines 1970)
• Frequency analysis: wavelet transform results at A1 and M1 1. Intro. Simulation Observation
• Frequency analysis: wavelet transformresults at A2 and M2 1. Intro. Simulation Observation
• Principal-axis analysis results 1. Intro. Simulation Observation
• Wavenumber analysis results 1. Intro. Simulation Observation ~ 100–200 km ~ 100–150 km
1. Intro. 1. TRW generation due to typhoon Songda • Relative-vorticity analysis of simulated signals to investigate generation mechanism of the signals Quasi-geostrophic eq. on the f-plane TRW governing eq. - Seek for relationship between near-surface and near-bottom relative vorticity fields Hypothesis Ekman transport PV conservation Cyclonic wind forcing Deep cyclone Upwelling
• Relative-vorticity analysis results 1. Intro. Time Near-surface Near-bottom
• Verification of relative-vorticity analysis results 1. Intro. Intense upwelling near S06 in real ocean? Observation Simulation
1. Intro. Conclusion • 2.75–5.5-day TRW signals observed right after the passage of typhoon Songda (2004) are reproduced using a numerical simulation. • Principal-axis and wavenumber analyses indicate that the 2.75–5.5-day TRW groups propagate through the ADCP sites nearly parallel to isobaths with around 100–150 km wavelength. • Relative-vorticity analysis implies that the TRWs are mainly generated about 80 km northeast of the ADCP sites by the typhoon induced upwelling.
Second Chapter Simulation of oceanic frontal meandering induced by tropical cyclones Objective Investigation of frontal meandering developed after the passage of an idealized tropical cyclone (TC)
1. Intro. 2. Simulation of TC-induced frontal meandering • Princeton Ocean Model (POM) - Idealized domain with flat bottom at 2000 or 5000 m depth on the f-plane (35ºN) • Ocean Initial data : T & S products from the Kuroshio Extension System Study (KESS) • Wind forcing : an idealized TC with Holland wind profile. - TC parameter values Radius of Maximum Wind (RMW) : 70 km Maximum Wind Speed (Vm) : 45 m/s Translation Speed (U) : 5 m/s
• Qualitative description of control simulation results • Bottom depth : 2000 m • Color : temperature at 80 m depth • Arrow : current at 80 m depth • White dot and line : TC position and past track • Key points - Nearly stationaryLong-scale frontal meanders grow. - The most significant meander develops toward the cold water and downstream of and near the track. Frontal meandering is a sub-inertial ocean response, so near-inertial waves may not be important.
The upstream phase disappears, whereas the downstream phase emerges with its scale shorter than that upstream. 1.5-day lowpass-filtered meridional velocity and temperature fields at 80 m depth “Away from the front” vs. “At the front”
Weakened frontal current is quickly replaced by the upstream frontal current. 1.5-day lowpass-filtered zonal velocity and temperature sections along TC track (or across the initial front) Counter current occurs on the anti-cyclonic side of the frontal current.
Tilt of whole water column(so called backward tilt): not consistent with vertical shear of frontal current. Tilt of water column in the upper ocean: consistent with vertical shear of frontal current. 1.5-day lowpass-filtered meridional velocity and temperature sections along the initial front
• Comparison of simulation results to analytical solution of linear instability theory 1. Intro. - Frontal meandering has been studied in terms of barotropicand baroclinicinstabilities. - The idealized front has horizontally- & vertically-sheared current structure. - Apply mathematical methods based on previous studies of baroclinicfrontal systems (e.g., Lipps 1963; Garvine 1983; Killworth et al. 1984; Boss et al. 1996; and references therein)
• Two-layer shallow water equations (SWEs) with non-outcropping interface • Background state: h1 = H1*[1 – α*tanh(y/L)] • H1 = 363 m • L = 75 km => W = L / Rd ~ 2.3
• Lower-layer background velocity is ignored for the simplicity.
Upper-layer thickness Upper-layer current
• Phase propagation depends on the scale of the disturbance. (i.e. dispersive) • The disturbance scale should be long enough for the growth. (e-folding time scale for the scale of near 950 km : ~ 50 days ) Analytically-calculated fastest-growing-mode dispersion relation
1. Intro. • Comparison of simulation results to analytical solution of linear instability theory • c = Re(c) + iIm(c) = c(k) • Temporal evolution of upper-layer cross-frontal velocity field based on the analytical solution & Fourier-series method • Temporal evolution of simulated cross-frontal velocity field averaged in the upper-layer
Control simulation Superposition simulation
Upper-layer meridional velocity fields from superposition simulation with 5000 m bottom depth
Simulated upper-layer meridional or cross-frontal velocity profiles
Qualitatively consistent (upstream decay vs. downstream growth, and the dispersion depending on the scale) Quantitatively, the analytical solution underestimates the near-stationary growth of TC-induced disturbance. Simulated & analytical upper-layer meridional or cross-frontal velocity profiles
• What if there is no vertical shear? Surface elevation & velocity fields from barotropic simulation with 2000 m bottom depth TC-induced disturbance is geostrophically adjusted instead of becoming vortical or frontal waves. Rossby deformation radius is larger than disturbance and frontal scale.
• What if there is no horizontal shear? Surface elevation & velocity fields from horizontally-uniform-current simulation with 2000 m bottom depth Compared to the results from control simulation, vortical or frontal waves propagate faster with smaller growth rate. Frontal scale or width is much larger than the disturbance scale and deformation radius.
Superposition simulation Barotropic-component superposition simulation Importance of depth-averaged relative vorticity or total angular momentum provided by the TC, because the dynamics is essentially on vortical waves vertically coupled.
1. Intro. Conclusion • Idealized simulations imply the possible contribution of tropical cyclones to the frontal meandering. • Analytical solution of linear instability theory is qualitatively consistent with but quantitatively underestimates simulated TC-induced frontal meandering. • The frontal meandering is due to vortical waves trapped at the front and coupled vertically, thus propagating downstream and growing in time. • Depth-averaged relative vorticity or total angular momentum provided by the tropical cyclone is important in the meander development.
Third Chapter Simulations of sea surface cooling induced by tropical cyclones in oceanic frontal region Objective To study the effect of oceanic front on the sea surface cooling induced by tropical cyclones
1. Intro. 3. TC-induced sea surface cooling in frontal region • Princeton Ocean Model (POM) - Idealized domain with flat bottom at 2000 m depth on the f-plane (35ºN) • Ocean Initial data : T& Sdata from the Global Ocean Data Assimilation Experiment • Wind forcing : an idealized TC with Holland wind profile. - TC parameter values Radius of Maximum Wind (RMW) : 70 km Maximum Wind Speed (Vm) : 45 m/s Translation Speed (U) : 5 m/s
3. TC-induced sea surface cooling in frontal region 1. Intro. “TC-induced sea surface cooling may depend not only on TC parameters but also on the frontal advection and cross-frontal gradient of ocean heat content (OHC).” - Additional simulation results are compared to control simulation results in terms of the SST averaged within a RMW or twice RMW of the TC center.
Sea surface temperature and velocity fields from control simulation (a) (ΔSST)min ~ -2 °C in the right-rear quadrant (b) (ΔSST)min ~ -4 °C in the right-front quadrant (c and d) (ΔSST)min ~ -10 °C in the right-rear quadrant
Relative warming:frontal currentadvectsthe cold wake out of the TC core region. 1D simulation does not include the upwelling which becomes important in the shallow mixed layer region (or after the passage over the front). Effect of frontal advection on TC-induced sea surface cooling
Much less cooling due to much thicker mixed layer It appears that the sea surface cooling in the shallow mixed layer region is enhanced a little due to the presence of the front. Possible role of frontal current shear in enhancing the turbulent mixing or upwelling Effect of ocean heat content on TC-induced sea surface cooling
1. Intro. Conclusion • During the TC passage over the oceanic front, the sea surface cooling increases due to the cross-frontal gradient of ocean heat content. • At the same time, the frontal current advectsthe cold wake out of the TC core. • The TC-induced sea surface cooling appears to be enhanced on the cyclonic side of the front, suggesting the possible role of the cyclonic shear.