Download
1 / 36
360 likes | 556 Views
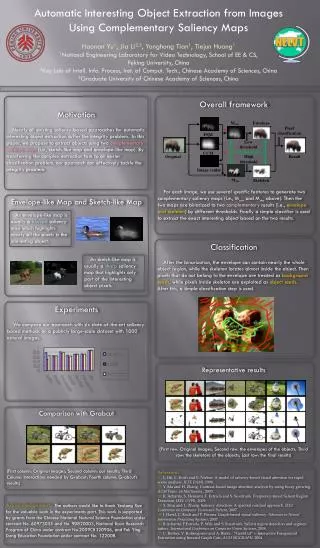
Boundary Extraction in Natural Images Using Ultrametric Contour Maps. Pablo Arbel á ez Universit é Paris Dauphine Presented by Derek Hoiem. What is segmentation?. What is segmentation?. Segmentation is a result. Face. Woman. What is segmentation?. Segmentation is a result

E N D
Boundary Extraction in Natural Images Using Ultrametric Contour Maps Pablo Arbeláez Université Paris Dauphine Presented by Derek Hoiem
What is segmentation? • Segmentation is a result
Face Woman What is segmentation? • Segmentation is a result • Segmentation is a process
What is segmentation? • Segmentation is a result • Segmentation is a process • Segmentation is a guide
Segmentation as a Guide • Multiple Segmentations
Segmentation as a Guide • Multiple Segmentations • Hierarchy of Segmentations
Key Concepts/Contributions • Hierarchical segmentation by iterative merging • Ultrametric dissimilarities • Thorough evaluation on BSDS
λ Hierarchical Segmentation 3 Region Image Dendrogram Contour Image
λ Ultrametric Contour Map • Ultrametric • Definition: D(x,y) <= max{ D(x,z), D(z,y) } The union R12 of two regions R1 and R2 must have >= distance to adjacent region R3 than either R1or R2
Region Dissimilarity • Dc(R1, R2): mean boundary contrast • contrast(x) = max L*a*b* diff within radius of x • Dg(R1, R2): mean boundary gradient • gradient(x) = Pb(x) • Da(R1): Area + α3 Scatter (in color space) α2 D(R1, R2) = [Dc(R1, R2) + α1 Dg(R1, R2)] · min{ Da(R1), Da(R2)} Learned Parameters: xi = 4.5 α1 = 5 α2 = 0.2 α3 = 0
Examples Contrast Contrast + Gradient Contrast + Gradient + Region
Algorithm Summary • Create Initial Contours: • Extrema in gray channel form regions • Assign pixels to regions based on above ultrametric • Iteratively merge regions • Keep adjacency/distance matrix
Comparison • Martin et al. (Pb) • Canny edge detector • Hierarchical watersheds (using MFM for gradient) [Najman and Schmitt 1996] • Variational (global energy minimization)
Pb Brightness Gradient Oriented Edges Color Gradient Texture Gradient No Boundary Boundary [Martin Fowlkes Malik 2004]
Variational Method Originally Wavelet-based Textons [Koepfler Lopez Morel 1994]
Comparison • MFM: Martin et al. (Pb) • Canny: Canny edge detector • WS: Hierarchical watersheds (using MFM for gradient) [Najman and Schmitt 1996] • MS: Variational (global energy minimization) Edge-Based Region-Based
Best Results http://www.ceremade.dauphine.fr/~arbelaez/results-UCM/main.html
Best Results http://www.ceremade.dauphine.fr/~arbelaez/results-UCM/main.html
Best Results http://www.ceremade.dauphine.fr/~arbelaez/results-UCM/main.html
Best Results http://www.ceremade.dauphine.fr/~arbelaez/results-UCM/main.html