Mid-IR Spectroscopy of IRAS 20343+4129 IRS 1 and 3 - Astronomical Observations<br>
Study of IRAS 20343+4129 IRS 1 and IRS 3 using mid-IR spectra & high-resolution imaging to analyze emission, extinction, and luminosity. Models derived for HMPO candidates. <br>

Mid-IR Spectroscopy of IRAS 20343+4129 IRS 1 and 3 - Astronomical Observations<br>
E N D
Presentation Transcript
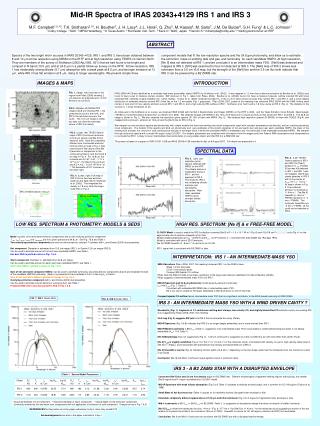
Mid-IR Spectra of IRAS 20343+4129 IRS 1 and IRS 3M.F. Campbell1,9,10, T.K. Sridharan2,10, H. Beuther3, J. H. Lacy4, J.L. Hora2, Q. Zhu5, M. Kassis6, M. Saito7, J.M. De Buizer8, S.H. Fung1 & L.C. Johnson11 Colby College 2 SAO 3 MPIA Heidelberg 4 U Texas Austin 5 Rochester Inst. Tech. 6 Keck O 7 NAO, Japan 8 Gemini S 9 mfcampbe@colby.edu 10 Visiting Astronomer at IRTF ABSTRACT Spectra of the two bright mid-ir sources in IRAS 20343+4129, IRS 1 and IRS 3, have been obtained between 8 and 13 m at low resolution using MIRSI on the IRTF and at high resolution using TEXES on Gemini North. They are members of the survey of Sridharan (2002 ApJ 566, 931) that we had found to be bright and compact in N band (10.5 m) and at 24.8 m in a partial follow-up survey on the IRTF. At low resolution, IRS 1 has moderately strong silicate (9.7 m) absorption with a weak peak at 8.5 m, and stronger emission at 13 m, while IRS 3 has flat emission at 8 m, rising to longer wavelengths. We present simple three component models that fit the low resolution spectra and the 24.8 m photometry, and allow us to estimate the extinction, mass of emitting dust and gas, and luminosity for each candidate HMPO. At high resolution, [Ne II] was not detected at IRS 1, and we conclude it is an intermediate mass YSO. [NeII] was detected and mapped at IRS 3. [SIV] was searched for but not detected at IRS 3. The [NeII] map of IRS 3 shows less extension than a 3.6 cm VLA map, but the strength of the [Nell] line and the 3.6 cm flux both indicate that IRS 3 can be powered by a B2 ZAMS star. IMAGES & MAPS INTRODUCTION H2 2.12 m & 1.2 mm continuum (contours) FIG. 1. (Upper, left) Overview of the region from Palau (2006) showing 2 m emission as grayscale and 1.2 mm emission as contours. IRAS 20343+4129 was identified as a candidate high-mass protostellar object (HMPO) by Sridharan et al. (2002) It was mapped in 1.2 mm dust continuum emission by Beuther et al. (2002a) and found to have a pair of massive clumps oriented ~EW (contours in Fig 1., taken from Palau, 2006). Beuther et al. (2002b) found it to have a massive molecular outflow oriented NS with lobes extended EW, centered roughly between the 1.2mm clumps. Kumar et al. (2002) observed shocked H2 in the 2 m K band around sources they named IRS 1 and IRS 3, and a cone-shaped distribution of extended emission around IRS 3 that lies on the 1.2 mm peaks (Fig. 1 grayscale). Pilau (2006, 2007, poster at this meeting) has observed IRAS 20343 with the SMA, finding small clumps of dust and CO low velocity emission around IRS 1 and IRS 3, and a high velocity EW outflow at IRS1. Sridharan et al. had found a 1.8 mJy source at IRS 3 (Fig. 4). The distance to the sources is 1.4 kpc (Sridharan, et al.). As follow-ups to the Sridharan et al. survey, we observed IRAS 20343 with the Mid-Ir Spectrometer and Imager (MIRSI) on the IRTF in 2003, and the Texas Echellon Cross Echelle Spectrograph (TEXES) in its Demonstration Science Run on Gemini N in 2006. We obtained images with MIRSI in the 10.5 m N band and in a band at 24.8 m that show both IRS 1 and IRS 3. The 24.8 m image is shown in Fig. 2. We also obtained low resolution grism spectra (R~100) of them with MIRSI (Fig. 5). We obtained high resolution spectra (R~80000) of them with TEXES (Fig 6), and mapped both continuum emission at 12.8 m and the [Ne II] line for IRS 3 (Fig. 4). We interpret our low resolution spectra and photometry with simple models that have two emitting dust cloud components (each with constant temperature and density), and an overlying absorbing cloud component. The models fit the spectra and 24.8 m photometry and give estimates of the column densities of hot and warm dust and gas near each candidate HMPO, the mass of the emitting dust and gas, the amount of cold overlying dust and gas in the larger cloud in which the candidate HMPO is embedded, and the luminosity of the embedded candidate HMPO. We interpret the high resolution spectra with a model HII region using CLOUDY. Our models’ parameters are combined with information from the images and from Palau’s SMA observations and interpretations to conclude that IRS 1 is likely to be an intermediate mass protostellar or young stellar object, and that IRS 3 is a ZAMS B2 star. This poster is based on a paper on IRAS 18151-1208 and IRAS 20343+4129 submitted to ApJ on 8 August 2007. Full details are presented in it. FIG 2. (Middle,l eft) MIRSI-IRTF image at 24.8 m showing IRS 1, the unresolved source in the north, and IRS 3, the resolved source in the south. The 10.5 m image is similar but does not show the extended nature of IRS 3 as clearly. FIG 3. (Lower, left) TEXES-Gemini maps of IRS 3 continuum emission at 12.8 m (green) and [Ne II] line emission (red). Note the completely different axis of extended emission from the 24.8 m map in Fig. 2. Also note the point-like nature of the [Ne II] emission in comparison to the continuum emission, and the VLA 3.6 cm map in Fig. 4.For 12.8 m, the contours are at 1.67, 3.34, …11.7 x 10¹⁰ Jy sr-1. For [Ne II], the contours are at 2.4, 4.0,…10.0 x 10⁶ W m-2 sr-1. The beamsize of 0.5” is shown in the lower right. IRS 1 & IRS 3 MIRSI-IRTF SPECTRAL DATA FIG. 6. (Left)TEXES-Gemini spectra of IRS 1 and IRS 3 for [Ne II] plotted in VLSR. The [Ne II] line was not detected in IRS 1, and IRS 1 was not mapped. [Ne II] was clearly detected in IRS 3 with its line center at VLSR=15.7 +/- 1 km s-1.Its map is shown in Fig. 3. The molecular emission is centered at 11.4 km s-1. The [Ne II] linewidth is ~8 km s-1 FWHM (resolution is ~4 km s-1 FWHM). The molecular linewidths are ~3 km s-1 FWHM. [S IV] could not be detected at IRS3. FIG. 5. (Left)Low resolution grism spectra obtained with MIRSI on the IRTF. The silicate feature is moderately strong in IRS 1, and not apparent in IRS 3. The model for IRS 3 has underlying silicate emission just canceled by absorption. Most other candidate HMPOs show stronger silicate absorption. FIG. 4. (Lower, right)VLA map of IRS 3 3.6 cm free-free emission based on the data cited in Sridharan et al. (2002). The integrated flux density is 1.8 mJy. Note the larger scale than in Fig. 3. IRS 3 TEXES-Gemni 12.8 m IRS 3: VLA 3.6 cm LOW RES. SPECTRUM & PHOTOMETRY: MODELS & SEDS HIGH RES. SPECTRUM: [Ne II] & e- FREE-FREE MODEL CLOUDY Model is used to match the IRS 3 extinction corrected [Ne II] of F = 1.3 x 10⁻¹⁶ W m-2 (Fig. 6) and VLA 3.6 cm F.mJy (Fig. 4) for the approximate size of emission mapped by the VLA. Model’s stellar parameters are Teff ~ 20000 K and NLyc ~4x1044 photons s-1, consistent with a B2 ZAMS star (Panagia 1973). Model is consistent with lack of [S IV] emission. [Ne II] FWHM linewidth of ~8 km s-1 is narrow for an UC HII. IRS 1 upper limit is consistent with B3 ZAMS or later. Model consists of hot and warm emission components and a cold overlying extinction component. Thot, hot,Twarm, warm and absorption arefit to grism spectra and 24.8 m. See Fig. 7& 8 and Table 1. Two underlying emission components are end-on uniform density, constant T cylinders with Li and Draine (2003) dust properties. Hot component: Diameter is estimated from 10.5 m image (IRS 1) or Gemini 12.8 m image (IRS 3). Can be used to estimate amount of hot dust near candidate HMPO: see Table 1. Hot dust SED is plotted in blue in Fig. 7 & 8. Warm component: Diameter is estimated from 24.8 m image. Can be used to estimate amount of warm dust near candidate HMPO: see Table 1. Warm dust SED is plotted in Green in Fig. 7 & 8. Sum of hot and warm component SEDs: Can be used to estimate luminosity, assuming the two components absorb and reradiate the bulk of the candidate HMPO’s luminosity. (Near-ir is presumed to be re-radiated in Far-ir.) See Log Le in Table 1. Sum of Hot and Warm SEDs is plotted in Orange in Fig. 7& 8. Overlying extinction component with Li and Draine (2003) dust properties. Can be used to estimate column density of overlying dust: see Table 1. Predicted SED with extinction plotted in Red in Fig. 7 & 8. INTERPRETATION: IRS 1 - AN INTERMEDIATE-MASS YSO SMA Obsvations Palau (2006, 2007, this meeting) observed IRS 1 on the SMA to have: Weak 1.3 mm dust peak. CO(2-1) low velocity peak. Compact EW bipolar CO outflow. Palau finds the SMA CO lobe to be major contributor to the large scale massive redshifted CO lobe of Beuther (2002b). Palau suggests a low/intermediate mass YSO is at IRS 1. MID-IR Spectrum and 24.8 m photometry model gives AV=46 and a luminosity Le=1400 Lsun (Fig. 7, Table 1): Consistent with embedded B3 ZAMS star or intermediate-mass YSO. B3 is too cool to create an HII region detectable in [Ne II] emission or 3.6 cm free-free. Compact bipolar CO outflow favors intermediate-mass YSO that is a significant contributor to the IRAS-based luminosity of IRAS 20343. FIG. 7. IRS 1 Model SEDs FIG. 8. IRS 3 Model SEDs IRS 3 - AN INTERMEDIATE MASS YSO WITH A WIND DRIVEN CAVITY ? Shocked H2 (Fig. 1), fragments of 1.3 continuum emitting dust clumps, low velocity CO, and slightly blueshifted CO indicate a cavity surrounding IRS 3 as suggested by Palau (2006, 2007, this meeting). VLA map (Fig. 4) suggests EW jets from IRS 3 that could create the cavity (Palau). MID-IR Spectrum (Fig. 5 & 8)indicates that IRS 3 is no longer deeply embedded, and is more evolved than IRS 1. MID-IR Model Luminosity is 850 Lsun (Table 1), suggestive of an intermediate mass YSO, but probably is underestimate because object is not deeply embedded (AV,a= 11.6, Table 1). [Ne II] Morphology does not suggest jets (Fig. 3). 12.8 m continuum is suggestive of a disk, but [Ne II] is at north end rather than center (Fig.3). [Ne II] VLSR is slightly redshifted (Fig. 6; 15.7 km s-1 vs 11.4 km s-1 for the molecular cloud), inconsistent with velocity of a jet or high velocity stellar wind of 200 km s-1 (Palau), and inconsistent with predominant low velocity and blueshifted CO at IRS 3. [Ne II] linewidth is narrow (Fig. 6)indicating intrinsic width of 4-6 km s-1 depending on the line shape, wider than the molecular lines, but narrow for a wind or jet model. Conclusion: [Ne II] and Mid-ir Continuum argue against a wind or jet driven cavity. IRS 3 - A B2 ZAMS STAR WITH A DISRUPTED ENVELOPE Table 1. Source Model Parameters Consistent [Ne II] flux and 3.6 cm flux density argue for B2 ZAMS star. Different morphologies of apparent emitting regions are puzzling, but smaller [Ne II] region than H+ region is predicted by CLOUDY model. MID-IR Spectrum with weak silicate absorption (Fig 5 & 8, Table 1) indicates a relatively evolved object, and is common for UC HII regions (Faison et al. 1998). Small Mass of hot dust near star (Table 1) argues forfor relatively evolved, disrupted inner envelope or disk. Extended, completely different appearances of 12.8 m and 24.8 continuum (Fig. 2 & 3) argue for fragmented inner envelope or disk. Mid-ir Luminosity is 850 Lsun (< 3500 Lsun for B2 ZAMS, Table 1) is suggestive of disrupted envelope that does not absorb full stellar luminosity. [Ne II] VLSR is offset from molecular cloud by ~4 km s-1 (Fig. 6. 15.7 km s-1 for [Ne II] vs 11.4 km s-1 for the molecular cloud)suggesting a motion of the star relative to its parent cloud that is not uncommon (Zhu et al. 2005). Linewidth is narrow for UC HII regions (Hoare et al 2007) but reasonable. Conclusion: [Ne II and Mid-ir Continuum are consistent with B2 ZAMS star with a disrupted natal envelope. 1 Assumed diameter of hot component. 2 Assumed diameter of warm component . 3 Optcal depth of cold extinction component. 4 Luminosity emitted by hot and warm dust components with out application of extinction of cold component. Orange curves in Fig. 7 & 8. REFERENCES for this poster are in the paper submission to Ap J, since they wouldn’t fit! Acknowledgements are also in the paper submission to Ap J.