Ultrametric phylogenies
200 likes | 683 Views
Ultrametric phylogenies. By Sivan Yogev Based on Chapter 11 from “Inferring Phylogenies” by J. Felsenstein. Introduction – additive trees. In the last lecture we saw the concept of distance based phylogenetic trees d(i,j) is the distance between the objects indexed i and j

Ultrametric phylogenies
E N D
Presentation Transcript
Ultrametric phylogenies By Sivan Yogev Based on Chapter 11 from “Inferring Phylogenies” by J. Felsenstein
Introduction – additive trees • In the last lecture we saw the concept of distance based phylogenetic trees • d(i,j) is the distance between the objects indexed i and j • In particular, we discussed additive sets, in which: • For each i: d(i,i) = 0, and for each ji: d(i,j)0 • For each i,j: d(i,j) = d(j,i) • For each i,j,k: d(i,k) ≤ d(i,j) + d(j,k) [triangle inequality] • Any subset of four objects can be labelled i,j,k,l such that d(i,j) + d(k,l) ≤ d(i,l) + d(j,k) = d(i,k) + d(j,l)[four points condition] • An additive set defines a tree. Every tree defines an additive distance matrix between its leaves
Molecular clocks • Let us assume that “stable” mutations in the genome occur uniformly over long time periods • This defines a “molecular clock” – each mutation stands for a constant period of time • We can therefore approximate the time since any two taxa diverged from their last common ancestor by the number of differences between the genomes in conserved regions
Ultrametric trees • Given a group of taxa with distances, if we assume the “molecular clock” model and wish to find the evolutionary tree, the number of mutations from the last common ancestor to every taxon should be similar • This means that the distance from the root of the evolutionary tree to each leaf is the same • Such a tree is called an Ultrametric tree
Ultrametric trees (cont.) • If we have a set of objects with a distance between them, we want to know if this set is ultrametric • For ultrametric sets, these condition hold: • For each i: d(i,i) = 0, and for each ji: d(i,j)0 • For each i,j: d(i,j) = d(j,i) • For each i,j,k: d(i,k) ≤ max{d(i,j), d(j,k)}[ultrametric condition] • The last condition can be replaced by this one: • Any subset of three objects can be labelled i,j,k such that d(i,j) ≤ d(j,k) = d(i,k)
Ultrametric trees (cont.) • An ultrametric set is also additive • The opposite is not always true Distance matrices Additive matrices Ultrametric matrices
Ultrametric decision • Given a set of n objects with distances, we want to determine if the set is ultrametric • The naïve approach – go over all triplets, and check if the ultrametric condition holds • Complexity – O(n3) • More efficient algorithms exists (Gusfield gives a simple O(n2logn) and a more sophisticated O(n2) algorithm with partial proofs)
Approximations • However, for most biological data there is no accurate “ultrametric solution” • This means that some heuristic is needed • The most popular method is UPGMA, which stands for Unweighted Pair Group Method using Arithmetic mean • Introduced by Sokal and Michener (1958)
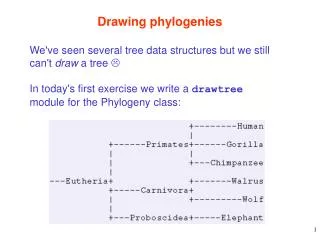
UPGMA • Input: A set of n objects, with a distance between every two objects • Output: an ultrametric tree with the given objects as leaves • The main data structures used by the algorithm are a graph G=(V,E) which contains trees with the objects as leaves, and a distance matrix between each two roots of trees in the graph
Bear Raccoon Weasel Seal Dog UPGMA (cont.) • Initialization: Each object in a separate tree, distance by input • We will use an example of 5 mammal species
UPGMA (cont.) • We iterate until there is only one tree • At each iteration we perform: • Find the two trees x and y with minimal distance d(x,y) • Add a new node, and connect the roots of x and y to this node. The result is a new tree z. The height of the root of z is d(x,y)/2 • Compute the distance between z and the other remaining trees (without x and y)
BR 13 13 Bear Raccoon Weasel Seal Sea lion UPGMA (cont.) • First iteration:
UPGMA (cont.) • Update computation – denote the number of leaves in the tree x by nx, then for each t x,y we set:
BRS 18.25-13=5.25 18.25 BR 13 13 Bear Raccoon Seal Weasel Dog UPGMA (cont.) • Second iteration:
BRSW 20-18.25=1.75 20 BRS 18.25-13=5.25 18.25 BR 13 13 Bear Raccoon Seal Weasel Dog UPGMA (cont.) • Third iteration:
BRSWD 22.625-20=2.625 22.625 BRSW 20-18.25=1.75 20 BRS 18.25-13=5.25 18.25 BR 13 13 Bear Raccoon Seal Weasel Dog UPGMA (cont.) • Fourth (and last) iteration:
UPGMA - complexity • A simple implementation takes n-1 iterations, where in each iteration we find the minimal distance at O(n2), with total complexity of O(n3) • We can keep a list of the smallest distance in each row. This way it takes O(n) to find the minimal distance, while updating the list is also O(n) at each iteration. Therefore, the total complexity is O(n2).
Ultrametric evaluation • UPGMA gives us an ultrametric tree • Is this tree the best possible? • Depends on how we measure the quality of an approximated tree for a given matrix • Let U(i,j) be the distance in the ultrametric tree U between the objects indexed i and j • The L norm is defined by:
Ultrametric evaluation (cont.) • There is an O(n2) algorithm for finding the ultrametric tree U with minimal L norm (Farach, Kannan and Warnow, 1995) • Is this tree the best possible? It would be better to include all distances • The L1 norm is defined by: • Finding U with minimal L1 norm is NP-hard!(Day, 1987)