Download
1 / 39
390 likes | 396 Views
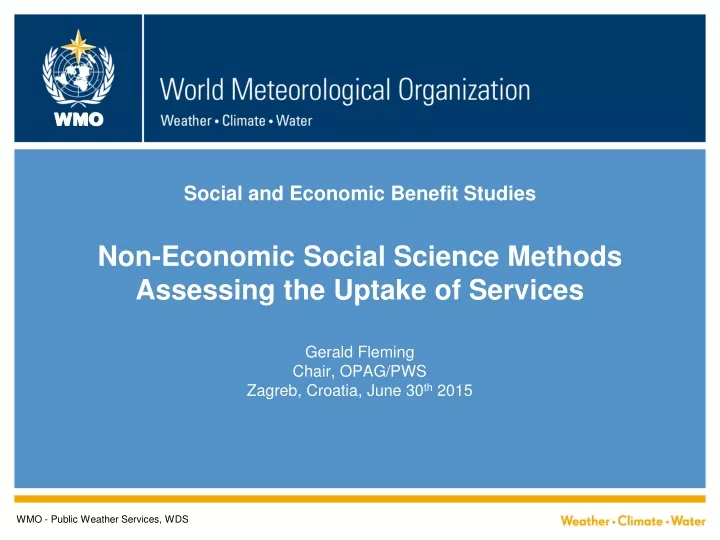
Social and Economic Benefit Studies Non-Economic Social Science Methods Assessing the Uptake of Services. Gerald Fleming Chair, OPAG/PWS Zagreb, Croatia, June 30 th 2015. WMO - Public Weather Services, WDS. Social Sciences.

E N D
Social and Economic Benefit StudiesNon-Economic Social Science MethodsAssessing the Uptake of Services Gerald Fleming Chair, OPAG/PWS Zagreb, Croatia, June 30th 2015 WMO - Public Weather Services, WDS
Social Sciences • Social science is a major branch of science, and a major category of academic disciplines, concerned with society and the relationships among individuals within a society. • Social science dates from the Age of Enlightenment, and attempts to use scientific methods to examine social behaviour and characteristics. WMO Public Weather Services
Social Sciences • Some of the Social Sciences: • Sociology • Human Geography • Economics • Political Science • Psychology • Demography • Anthropology • etc etc... WMO Public Weather Services
Social Sciences • Some of the Social Sciences: • Sociology • Human Geography • Economics • Political Science • Psychology • Demography • Anthropology • etc etc... WMO Public Weather Services
“Assessing the Uptake of Services” • What does this mean? It’s much easier to assess the uptake of Products • Trial new products • Refine them • Put them on sale • Measure the uptake (sales) WMO Public Weather Services
“Assessing the Uptake of Services” • How do we measure Services? NMHSs have historically been very good at producing forecasts and warnings. Once they are issued – what happens to them? Do we know HOW people use them? Often we have no clue about this WMO Public Weather Services
Weather Warnings What ways can we assess these? • Measure accuracy of the warnings • Measure number of warnings issued • Measure whether warnings reached intended users • Measure whether or not the warning was understood WMO Public Weather Services
Weather Warnings What ways can we assess these? • Measure whether the consequences of the likely weather were understood • Measure the intended behaviour of the user before and after receiving the warning • Measure the warning outcomes • Measure the satisfaction of the users WMO Public Weather Services
Weather Warnings What ways can we assess these? • Measure accuracy of the warnings • Measure number of warnings issued • Measure whether warnings reached intended users • Measure whether or not the warning was understood √ √ X X WMO Public Weather Services
Weather Warnings X X X √ What ways can we assess these? • Measure whether the consequences of the likely weather were understood • Measure the intended behaviour of the user before and after receiving the warning • Measure the warning outcomes • Measure the satisfaction of the users WMO Public Weather Services
Weather Forecasts and Warnings We need to know more about the behaviour of those who receive the warnings • Especially – decision-making • Was it rational? • Was it logical? • Was it intuitive? WMO Public Weather Services
Weather Forecasts and Warnings Decision-making by Users • What are the constraining factors? • Are there options? • Were these options weighed-up in an appropriate manner? • How did other peoples behaviour influence the decision-maker? • What were the uncertainties? All-in-all, a complex area for study. WMO Public Weather Services
Weather Forecasts and Warnings How can we get to understand users – individually and collectively? • Surveys • Focus Groups • Seminars • Field Research WMO Public Weather Services
Weather Forecasts and Warnings Surveys • Can be random (e.g. telephone surveys) or self-selecting (e.g. users of websites) • Can be Closed (questions with a limited range of answers) or Open (invite free text / comment) • Were the questions properly designed (e.g. not asked in a leading manner) • Were the number of respondents statistically significant? WMO Public Weather Services
Weather Forecasts and Warnings Field Surveys • Can entail close collaboration with decision-makers, to observe their activities and processes at first hand (intrusive) • Can use other data sets • Health statistics • Traffic information • Consumer behaviour • Agricultural inputs and outputs • Communication / Social Media data WMO Public Weather Services
Weather Forecasts and Warnings All surveys • Must be careful to recognise the differences between “Stated Preference” (what people say they will do) and “Revealed Preference” (what they actually do, as indicated by the evidence. Understanding user needs is much more complex than just asking them! A research area in itself. WMO Public Weather Services
Weather Forecasts and Warnings In this context... • Economics can be seen as the study of social behaviour as revealed by financial evidence • Social Sciences encompass a broader, more holistic view of social behaviour WMO Public Weather Services
Surveys of Users Need to know the profile of the survey respondents • Male / Female • Age group • Occupation • Location • etc etc.. WMO Public Weather Services
Surveys of Users A recent example from Met Éireann • Survey conducted of users of the website met.ie • Therefore not a random survey, but self-selecting • Website users could choose whether or not to take the survey • Each user asked only once (minimise the nuisance value) • Mix of Closed and Open questions WMO Public Weather Services
General information Current survey Previous Survey Benchmark Content Demographics User feedback Benchmark Summary Aboutthe survey
Who Are Your Users? Gender – Device Number of answers: 5,172 Women 41% Number of answers: 38,857 Number of answers: 44,029 Men 59% Gender - Website Number of answers: 37,863 Number of answers: 92,193 Number of answers: 48, 204 Number of answers: 33,138 Number of answers: 44,029 Note: Percentagesarerounded to the closestwholenumber.
Occupation Device Number of answers: 6,509 Number of answers: 41,515 Number of answers: 48,024 Website Number of answers : 41,977 Number of answers: 97,815 Number of answers: 52,111 Number of answers: 34,963 Number of answers: 48,024 Note: Percentagesarerounded to the closestwholenumber.
Age - Device Number of answers: 48,152 Number of answers: 41,613 Number of answers: 6,539 Note: Percentagesarerounded to the closestwholenumber.
Frequency Device Number of answers: 6,728 Number of answers: 42,584 Number of answers: 48,005 Website Number of answers: 42,147 Number of answers: 98,599 Number of answers: 51,787 Number of answers: 36,852 Number of answers: 48,005 Note: Percentagesarerounded to the closestwholenumber.
« Attractive/Ugly Desktop Make it slightly more visually appealing. I really like the short range and 5 day forecasts. However, I think thye could be jazzed up a bit and be more prominent on the site. Also often the time on the scale does not reflect the time on the map - thye can be out of synch. rainfall radar is brilliant but it could always be better more information or improved animation would be nice the image of the website could be brightened up.A little bit more user friendly, I humbly suggest that it should be more graphical. Include Animations for Forecasts as well as last few hours. (Similar to rain radar, but also projected into the future.) Include Wind Speed, Temperature and Rain fall in animations. Have a look at www.theyr.com to get ideas. would be nice to have the animated forecast screen bigger, it's all a bit small maybe a little more visual Number of answers: 43,818 « Tablet I would Maybe change the Back ground Colours but other the That always very Professional Make the map on the right hand side a littlebigger. I always zoom in. More colour, bigger print Please make the website a little more attractive and educative for the kids as well!! surely you can design a better, more attractive website? It could be significantly updated to look more attractive and make gathering information more intuitive Larger text; more interaction; more colour Better graphics of current and incoming weather.24hr,48hr72hr. Note: Percentagesarerounded to the closestwholenumber.
« Trust The website gives an impression that the organization behind it is professional and trustworthy Desktop Some of the comments never get updated and hence lose their message (Water Safety bulletin as example) Gives me what I want and I trust it. How about slicker images! I'm thinking along the lines of 3D. Having said that, I'd rather the content to remain as accurate and professional as it is. Sometimes the graphics suggest weather different to the text. Maybe on the home page there should be three maps depicting morning, afternoon and evening and including temps and wind on the one map. There should be proper editing of the written forecast on the home page. It is unusual not to find several typos/errors on any given day. This looks unprofessional and could easily be eliminated. If it was possible to have a rainfall radar with a predictive sequence for 3/6 hrs ahead it would be super as I use this every day for work and fully depend on this Number of answers: 44,051 « Tablet As a teacher I use the website occasionally as a teaching tool perhaps some simplified links for children to help them read weather update sect more easily Keep it professional/technical, don't simplify it in an effort to modernise/attract larger audiences. For the outlook forecast, breaking it out more clearly by day would make it easier to follow - eg Monday - showers... Monday night -... Avoid lengthy sentences. Short punchy key points are more effective. Language used is often more conversational than professional. It could look a bit more modern and professional but otherwise I feel its a very good website for updated weather warnings and of course regional weather warnings. More information please and a more professional appearance. But I like its simplicity so don't lose that. Define the terms and phrases used in the forecasts. For example I don't know what winter showers are as opposed to showers. Anyone I ask guesses but don't know either. thanks and good luck. Note: Percentagesarerounded to the closestwholenumber.
Usability index - benchmark Navigation Navigation Relevance Relevance Trust Trust Speed Communication Speed Communication Note: Percentagesarerounded to the closestwholenumber.
Open Survey Answers WMO Public Weather Services
Open Survey Answers WMO Public Weather Services
WMO Service Delivery Strategy One of the key strategic thrusts of WMO Helping NMHSs to better deliver their products and services to users Incorporates an Implementation Plan Designed to be a practical guide to the steps we must all take to improve our services Incorporates the “Service Delivery Progress Model” A technique to help us find out how good (or bad) we are at Service Delivery, and how to improve. WMO Public Weather Services 31
Service Delivery Progress Model • Defines five different stages of development for NMHSs (each over a number of elements) • Undeveloped • Development Initiated • Development in Progress • Developed • Advanced WMO Public Weather Services
Service Delivery Progress Model • Defines six elements of development • Evaluate user needs and decisions • Link service development and delivery to user needs • Evaluate and monitor service performance and outcomes • Sustain improved service delivery • Develop skills needed to sustain service delivery • Share best practices and knowledge WMO Public Weather Services
Service Delivery Progress Model WMO Public Weather Services
Service Delivery Progress Model WMO Public Weather Services
Service Delivery Progress Model WMO Public Weather Services
Social Sciences and Met Services • Its all about the users! • Improving our knowledge and understanding of those who use forecast and warnings services • Helping users to get more from our forecast and warnings services • Trying to understand decision-making, in all its complexity • Try to get to some measure of the ultimate outcomes for society of the services provided by NMHSs WMO Public Weather Services