Download
1 / 30
310 likes | 515 Views
Grizzly Bears in the Kootenays. Michael Proctor Trans-border Grizzly Bear Project. Current and historical North American grizzly bear distribution. Shaded area is current distribution. Trans-border Grizzly Bear Project A partnership working on both sides of the Canadian – US border.

E N D
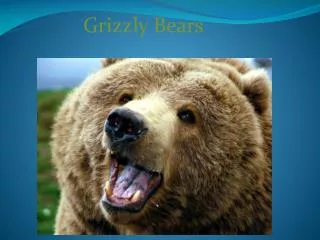
Grizzly Bears in the Kootenays Michael ProctorTrans-border Grizzly Bear Project
Current and historical North American grizzly bear distribution Shaded area is current distribution
Trans-border Grizzly Bear Project A partnership working on both sides of the Canadian – US border • Team Canada • US Fish & Wildlife Service • Idaho Fish & Game
Improve linkage Guarantee habitat security Reduce human-caused mortality Augmentation Education What we do: Comprehensive strategy of enhanced management
South Purcell/Yahk 40 bears Declining 3% annually South Purcell and South Selkirk Trans-border populations: small, fragmented, and threatened
75 75 500+ 500 300 30 50 Large Pops - consider linkage mgmt 40 470+ 30 Small Pops - urgent need for linkage mgmt Regional grizzly bear fragmentation in southern Canada Internal dotted lines represent limited female movement – solid yellow (& brown) limited male and female movement, red lines are highways Implications
Hunt quota lowered by BC gov Hunt rate lowered by BC gov Research estimate1 BC Gov estimate 87 (159) 92 Population estimates for GBPUs in Purcell Selkirk region (148) 58 (58) 20 (44) 1Proctor et al. 2007
Dearth of females in Yahk GBPU 20-24 grizzly bears in unit 25% are adult females - 4-5 Yahk GBPU 3 females known dead in last few years + unknown (1:1 ratio)
Live capture 1 female capture / 74 trap nights 1 Grizzly capture / 41 trap nights DNA surveys 26 female captures / 3 years of surveys Live capture 1 female capture / 568 trap nights 1 Grizzly capture / 95 trap nights DNA surveys 2 female captures / 3 years of surveys Dearth of females in Yahk GBPU supporting evidence S Purcell GBPU Yahk GBPU Fragmentation – female isolated
Access management standards in US What went into them
Accepted research Bears avoid roads and human features Motorized vehicles of all kinds and shapes Human developments accompanied by people More human traffic = more avoidance Avoidance buffer is up to 500m Adult females are most important to a population’s health Adult females select habitat with some % (55-68) of secure area Secure habitat defined as areas with no human access(habitat > 500m from motorized access)
Larger study area Female HRs Mace et al. 1996 YES They contained 56% secure areas no motorized access And average road density ~0.6 km/km2 Are there differences in habitat where females chose to live?
Mace et al. 1996 Clear conclusion – security selected by females more traffic = more avoidance There is a relationship between human access, mortality, and displacement Legal standard 68% of BMUs to be “core” (0km/km2) Average road density – 0.6 km / km2 19% can have > 1 km / km2 19% can have > 2 km / km2
Wakkinen and Kasworm 1997 US Purcell, and Selkirk Mts Concluded 55% core was adequate no more than 33% > 1 km / km2 no more than 26% > 2 km / km2
Grizzly bear management units ~ Size of female home range, used to spread accessmanagement around GBPU
Grizzly bear management units Roads in the Yahk area
Roads in US Yaak Roads in the broader Yahk region
Note effect of access management (closed roads) on US Yaak road density Roads in the broader Yahk region
Local female grizzly bears selection of “core habitat” as a % of home range core habitat = habitat > 500m from a motorized road Female GB % core habitat Irish survived & reproduced 0.55 Kelly survived & reproduced 0.44 0.54 Maeve survived & reproduced Marilyn died before reproducing 0.45 Terri trouble keeping offspring alive 0.38 Yahk GBPU average 0.29 S Purcell GBPU average 0.53
21% 34% 36% 39% 34% Grizzly bear management units and % core The goal = 0.50 – 0.60% core to support females that survive and reproduce
Resource Selection Function (RSF) modeling To identify high quality grizzly bear habitat for consideration for access management
Trans-border Grizzly Bear Project research 18,000 GPS telemetry locations for 13 grizzly bears 4 females 9 males
Input variable for Resource Selection Function models – habitat modeling
Exp (β0 + β1*Var1 + β2*Var2...) 1 + Exp (β0 + β1*Var1 + β2*Var2…) Prob (occur) = Logistic regression models
Higher quality grizzly bear habitat (green shaded) Black polygons encompass “core” habitat. Blue are Hwy 3 linkage areas to consider access management (AM) To use as options for AM to optimize gain for female grizzly bears. Green shaded areas are a composite of male and female habitat during spring and fall. Sex and season partitioning is possible