Field trip assignment
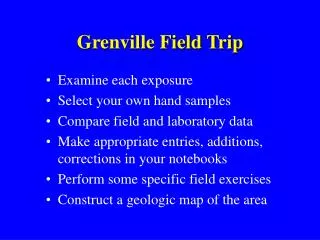
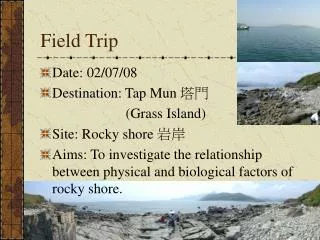
Field trip assignment. Table of data will be posted on website tomorrow (Friday) Draft due in drop box next Thursday, Oct 23rd If did not attend field trip, and collecting own data, contact Katie for feedback on your plan. No in-class lecture on Oct. 30th.


Field trip assignment
E N D
Presentation Transcript
Field trip assignment Table of data will be posted on website tomorrow (Friday) Draft due in drop box next Thursday, Oct 23rd If did not attend field trip, and collecting own data, contact Katie for feedback on your plan
No in-class lecture on Oct. 30th Lecture will be pre-taped, and posted on site on the 30th ML in Indonesia on UNEP funded project developing model for landscape-scale assessment of High Conservation Value Forest (HCVF)
Aquatic environmentsFreshwater - Streams - LakesMarine - Coasts - Oceans - Estuaries • Key physical factor: properties of H2O • - holds mineral nutrients in solution • oxygen solubility declines with • increased temperature • - decomposition uses up oxygen, anaerobic conditions kill plants and animals • liquid over wide temperature range • ice less dense than water, so floats and insulates water below • high thermal capacity, so large water bodies maintain temperature
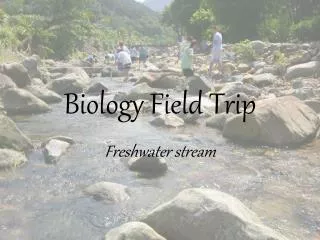
Stream Ecology-river & drainage basin form a unit-stream invertebrate communities depend on pH, temp & water flow-riparian vegetation influences: shading and leaf fall-endemism in geographically isolated drainage basins(e.g., the Cherokee Darter)-floodplain and pollution issues extreme
Lake Ecology-shoreline & habitats determined by depth-stratification by water temperature & O2-source of water determines ion concentrations & organism distributionsClear Lake, CA: long-term ecological research site
Ocean Ecology- basis of food chain are photosynthetic planktonic algae- radiation drops exponentially with depth: euphotic zone in top 100m - productivity in much of tropical oceans limited by mineral elements (N, P & perhaps Fe (iron)- cold, dark abyss is biological desert, but with diverse, fantastic organisms, poorly explored Warm water coral bleaching
Zonation of seashore communities determined by wave action & exposure to air
Changes in distribution of vegetation are expected with climate change • (MAPPS Model) • Current biomes • if CO2 doubles • (60-70 yrs) • tundra reduced • >temperate forest • < arid lands
Population Ecology & Demography • Monitoring populations • Life tables: survivorship and fecundity schedules • Dispersal Oct 23rd lecture…. • Competition & population growth models • Life history theory
Definitions • Population: A group of individuals of one species in an area, though the size and nature of the area is defined, often arbitrarily, for the purposes of the study being undertaken. • Population ecology: The study of the variations in time and space in the sizes and densities of populations, and of the factors causing those variations. • Birth, death and movement are the processes determining abundance & distribution of organisms
What is an individual? • Unitary organisms: determinate development • Modular organisms: indeterminate growth -Grow by repeated production of modules (leaves, twigs, coral polyps) • Therefore, individuals are genets, or genetic individuals… but important to characterize population into size classes to indicate their ecological impact Modules separate: duckweed, hydra Modules connected: Flowers & leaves, Hydroid colony
Population density: The numbers in a population per unit area, or sometimes 'per unit volume', 'per leaf' or whatever seems appropriate. • Population dynamics: The variations in time and space in the sizes and densities of populations. • Populations change from 4 processes: Npresent = Npast + B - D + I - E
Population size and density data are typically estimates, not total counts Mark-recapture or re-sighting studies to estimate population size of mobile organisms To estimate N, total population size, note that r (the captured, marked & released individuals) is the same proportion of N as m (the proportion of recaptured, marked Individuals in n, the recapture sample; so r/N = m/n
Sampling sessile organismsplot or plotless methods (e.g., Estabrook Woods fieldwork)- randomized, stratified plots
Useful estimates may be ranked classes of abundance: leopard frog abundance depends on both the number of adjacent ponds occupied and neraby habitat
Generalized life cycle of unitary organism:- resources initially into growth, then reproduction- reproduction may occur once (semelparity) or repeatedly (iteroparity)
Resource allocation to different plant parts (growth vs. reproduction) over time(the perennial plant Sparaxis, South Africa)
Annual species dominate in deserts -- where rainfall unpredictable and rare- most are semelparous- pass inhospitable periods as dormant cysts, spores, seeds or eggs- can be many years (e.g., brine shrimp) Cryptobiosis: tolerating extreme dessication
Macaranga: rainforest pioneer species dominates after large scale disturbances- long seed dormancy until hot large gap opens
Life histories of species living > 1 year - perennials: generations overlap Iteroparous breeding once/yr Iteroparous breeding continuously Semelparous, dying after long-delayed reproduction (e.g., Pacific salmon)
Giant Pandas depend on semelparous bamboos(and hindgut fermentation and rapid passage to obtain enough energy!)
Life history model for a great tit population: iteroparous population with overlapping generations-squares are population densities (per ha)-triangles are % surviving from one stage to next
A Cohort Life Table: Phlox drummondiiage-specific survivorship = lx fecundity = mx basic reproductive rate= R
Cohort Life Table: Marmota flaviventrisgeneration time = 4.5 yrs
Static life table at two sites for the tree Acacia burkittii, Australiacohort size affected by grazing….But interpretation assumes constant survivorship & birth rates
Survivorship Curves: plots of proportions vs. logs- log plots show proportional changes as = slopes
Generalized Survivorship Curves I: humans in developed countries & their pets II: buried seeds in seed bank (?) III: common- high risk early death
Survivorship curves (and fecundity) vary with ecological conditions (sand dune annual plant Erophila) Effects of competition on age-specific survivorship
Dispersal vs. Dispersion: Spatial distribution patterns • Average density vs. “mean crowding” • U.S. humans: • 75/km2 vs. 3,630/km2 Pattern depends on spatial scale: Aphids aggregated on trees, but random within trees, & perhaps regular on leaves
Dispersal determining abundance Spread of Colorado beetle in Europe: 1922-64
Density-dependent dispersal: avoiding crowding Dispersal rates of newly hatched blackfly larvae % juvenile male barnacle geese dispersing from island breeding colonies