Download
1 / 28
280 likes | 510 Views
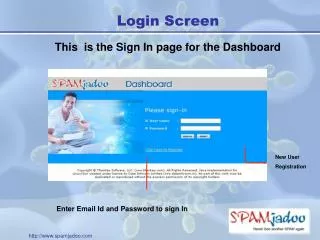
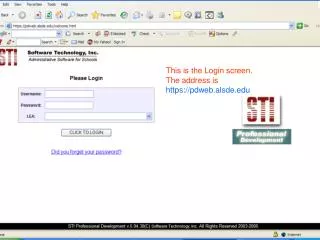
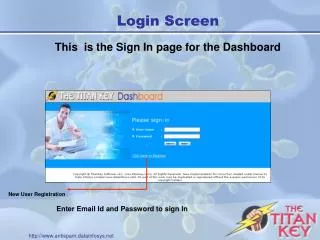
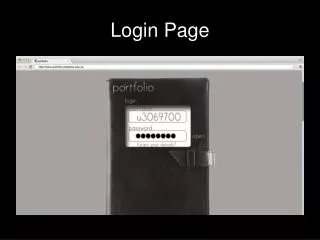
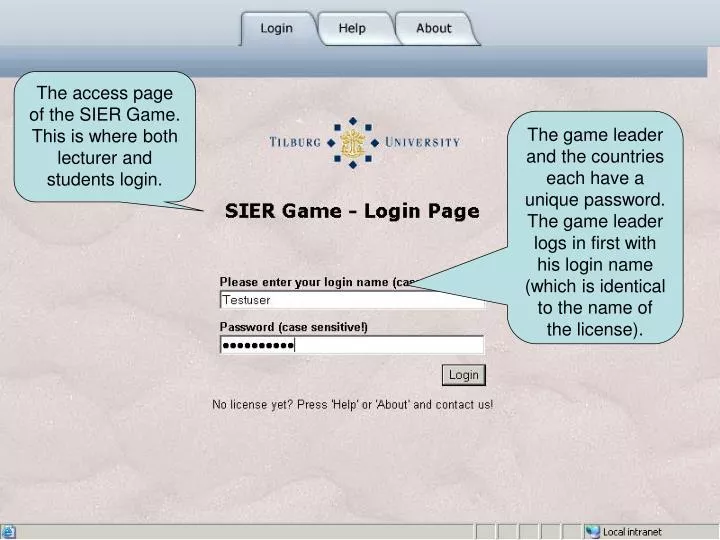
The access page of the SIER Game. This is where both lecturer and students login. The game leader and the countries each have a unique password. The game leader logs in first with his login name (which is identical to the name of the license).

E N D
The access page of the SIER Game. This is where both lecturer and students login. The game leader and the countries each have a unique password. The game leader logs in first with his login name (which is identical to the name of the license).
Navigation through the game’s pages is done through tabbed pages. The game version determines which pages are available. The status bar provides succinct information for the game leader and the students.
To start a new game, the lecturer goes to the Game leader tab.
To start a new game, the game leader chooses the game version, the number of countries in the game (with a maximum of 10, each country typically consists of 3 to 5 students) and the language of the interface (English or Dutch).
Finally, the game leader chooses: • whether students may access graphs that summarise the economic situation • whether import tariffs may be used in the first two game rounds • whether the game automatically progresses to a new round or only after intervention by the game leader. After choosing the desired options, a new game is started by pressing the button
Within a minute, the status bar informs the game leader that a game has been initialised. From this moment onward the game is ready to be used. The students may login and start the game.
After login, students may explore several aspects of the starting position: welfare components...
...the policies pursued in one’s own country and in all other countries...
To play the game, players go to the ‘Policy’ tab. The aim of the game is to add welvare and become the country in the world with the highest welfare. The students are governments of the countries and have economic policy tools at their disposal that they may use to attempt to maximise welfare. The may, among other, change tax rates, the level over government consumption and the number of civil servants.
This is where the students enter their desired policy changes In order to prevent trade wars from starting at the onset of the game, which would result in too little attention for other policy tools, import tariffs are not allowed in the first 2 game rounds, unless the game leader decided otherwise.
To prevent policy tools from being used inappropriately, players have to obey certain boundaries. This is why the size of policy interventions in each game round is subject to boundaries.
If a country is ready with entering its policy interventions, the policy mix is submitted.
Before the economic consequences of the policy mix can be calculated, all countries must submit their policy intentions. This follows from the interdependency between the economies of the countries. In some versions of the game, these interdependencies only take the form of trade flows, but bilateral capital flows are also possible (depending ojn the game version). As a consequence, the economy of a country is also influenced by policies in the other countries. Countries 1, 3 and 4 have submitted their policies, country 2 has yet to submit.
The game leader may intervene during the game, if deemed necessary. If the game leader wants the SIER game to advance a period, but a country has not submitted their policies, the game leader may start a new period by pressing this button. Note: if the game leader – at the start of the game – chose to manually advance to the next period, the new period will always have to be started by pressing this buttong.
If it turns out that, after calculation of a new period, a country ‘mistyped’ a policy, the game leader may decided, in exceptional cases, to roll back the last game period. This requires all countries to re-login and retype their policies for the last game round.
The game leader may enable or disable graphs for the players. The may be done at any point during the game. The game leader always keeps access to the graphs.
If all countries have submitted their policies (or if the game leader started a new game period manually), the consequences of the economic policies are calculated. All players are informed when the data for the new period is available via a message in the status bar.
A new game period has begun. The data of previous game rounds remain accessible. Players have the possibility to view all available data in 1 file, that can subsequently be easily printed or saved. The students may study the economic consequences of their policies. Country 3 has the highest welfare (the citizens of country 3 have the highest welvare and have more than 100.00 welfare points).
By clicking the ‘History’ tab, historical overviews may be accessed The students may access the historical overviews of all countries in the world.
There is a possibility to print the historical data or save it.
Players may view several graphs for all countries, using the ‘Graph’ tab This graph shows which welfare components have contributed to an increase or a fall in welfare. Country 4 is not performing well: welfare has decline in round 1.
The graphs may be viewed together in one file to facilitate printing. Country 3 did raise welfare. Note: players may view the tables and graphs of all countries. This enables them to learn from the policy mixes of the other countries.
Players may access a graph that depicts aggregate supply and demand in the product market. This graph can be used to analyse the main economic developments in their country.
In conjunction with the product market graph, an expert system is available that provides students with the main explanations for the shifts in the supply and demand lines.
After analysing the economic situation in their own country (as well as eyeing other countries), the graphs and the historical context, students are ready to formulate their next period’s policy mix. This closes the policy circle. In this manner, up to a maximum of 24 rounds may be played.
Are you interested to use the SIER Game at your classes? Or do you want a two-week ‘hands-on’ trial license? We are happy to help! Please contact us by mailing contact@siergame.nl or check the website www.siergame.nl/en.