Download
1 / 29
290 likes | 403 Views
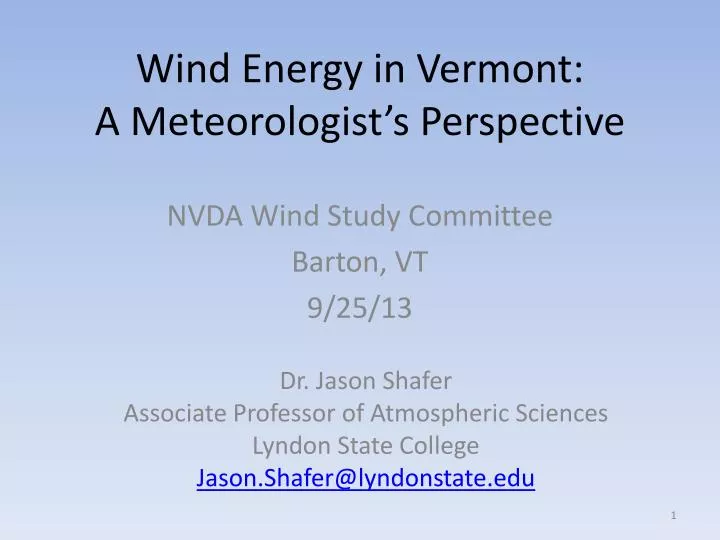
Wind Energy in Vermont: A Meteorologist’s Perspective. NVDA Wind Study Committee Barton, VT 9/25/13. Dr. Jason Shafer Associate Professor of Atmospheric Sciences Lyndon State College Jason.Shafer@lyndonstate.edu. Annual Wind Resource Climatology.

E N D
Wind Energy in Vermont: A Meteorologist’s Perspective NVDA Wind Study Committee Barton, VT 9/25/13 Dr. Jason Shafer Associate Professor of Atmospheric Sciences Lyndon State College Jason.Shafer@lyndonstate.edu
http://www.windpoweringamerica.gov/images/windmaps/us_windmap_80meters.jpghttp://www.windpoweringamerica.gov/images/windmaps/us_windmap_80meters.jpg
http://www.windpoweringamerica.gov/images/windmaps/vt_80m.jpghttp://www.windpoweringamerica.gov/images/windmaps/vt_80m.jpg
Newport Island Pond Lyndonville ~15 Stations in the NEK 10 with wind data All below 1400’ elevation
Wind Rose climatology for Lyndonville, VT Source: AWS True Wind
Burlington, VT Wind Direction Frequency Carrera et al. 2009 Similar to Lyndonville, the two dominant wind directions are from the south and northwest.
Wind Energy Production Wind energy production is very sensitive to small changes in wind speed, to the cube of the wind speed.
Fig. 2. Hourly vertical profiles of horizontal wind speed from HRD conical scans showing evening development of the LLJ near Lamar, CO, on 15 Sep 2003. Wind speed (m s−1) on horizontal axis, and height (m) on vertical axis. Profiles are color coded by time (UTC), which is 7 h ahead of local (mountain) standard time, so that 0100 UTC about sunset and 0700 UTC is midnight. Vertical resolution is 5 m. Turbine-rotor layer is indicated by horizontal dotted lines. (Figure courtesy of the American Meteorological Society.) Banta et al. 2013 One of the biggest challenges for producing accurate projections of wind resources is the assumptions made with the vertical profile with height in the lowest layer of the atmosphere; depends on the local terrain features and land-surface environment.
This is an example of a localized terrain effect, with the wind flow accelerating through Willoughby Gap; these nuances are impossible to know without collecting data.
Barnes and Polvani, 2013 Literature supports a shift of the midlatitude jet stream north, in this paper showing the largest migration of the Atlantic jet in Fall and least in Winter.
Average: 39.5 MPH Data courtesy Mt. Washington Observatory and Plymouth State University
Average: 5% Data courtesy Mt. Washington Observatory and Plymouth State University
Climate Change and Wind Resources • Observations: • We don’t know the answer, developing field, Global Climate Models need to be downscaled for this application • There will probably be some seasonal shift to wind resources • Year-to-year variability is larger than the long-term climate signal • There do not appear to be any long-term changes atop Mt. Washington
References • Banta, Robert M., Yelena L. Pichugina, Neil D. Kelley, R. Michael Hardesty, W. Alan Brewer, 2013: Wind Energy Meteorology: Insight into Wind Properties in the Turbine-Rotor Layer of the Atmosphere from High-Resolution Doppler Lidar. Bull. Amer. Meteor. Soc., 94, 883–902. • Barnes, Elizabeth A. and Lorenzo Polvani, 2013: Response of the Midlatitude Jets, and of Their Variability, to Increased Greenhouse Gases in the CMIP5 Models. J. Climate, 26, 7117-7135. • Carrera, Marco L., John R. Gyakum, Charles A. Lin, 2009: Observational Study of Wind Channeling within the St. Lawrence River Valley. J. Appl. Meteor. Climatol., 48, 2341–2361. • DOE, 2013: Energy Sector Vulnerabilities to Climate Change and Extreme Weather: http://energy.gov/sites/prod/files/2013/07/f2/20130716-Energy%20Sector%20Vulnerabilities%20Report.pdf • IPCC, 2012: Renewable Energy Sources and Climate Change Mitigation: Special Report of the IPCC. Cambridge University Press. 1088 p. Available: www.ipcc.ch/pdf/special-reports/srren/SRREN_Full_Report.pdf • NOAA ESRL Web Plotting Analysis Tools: http://www.esrl.noaa.gov/psd/cgi-bin/data/composites/printpage.pl