Download

1 / 58
580 likes | 963 Views
RENEWABLE SOURCES OF MECHANICAL ENERGY SC 208 Our Energy Future April 14, 2005 John Bush WIND, WATER, THERMAL GRADIENTS Hydroelectric Tidal and Ocean/River Currents Wave Wind Geothermal Ocean thermal COMMON FEATURES With minor exceptions they all provide electricity exclusively

E N D
RENEWABLE SOURCES OF MECHANICAL ENERGYSC 208 Our Energy FutureApril 14, 2005 John Bush
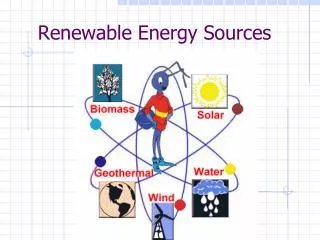
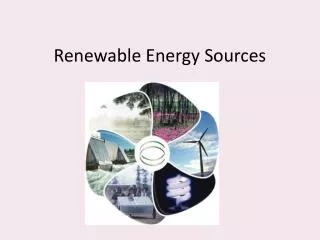
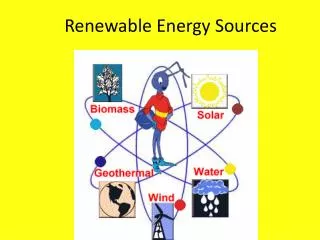
WIND, WATER, THERMAL GRADIENTS • Hydroelectric • Tidal and Ocean/River Currents • Wave • Wind • Geothermal • Ocean thermal
COMMON FEATURES • With minor exceptions they all provide electricity exclusively • They have very specific site requirements • They all have environmental or aesthetic negatives • Until recently only hydroelectric and geothermal were commercially useful
THE CASE OF HAWAII • Now almost totally dependent (90%) on imported oil for its energy • Has an increasing need for fresh water • Has access to ample renewable resources • Intense sunlight • Fast growing crops, particularly sugarcane • Strong, steady winds • Fast flowing streams • Ocean currents • Warm and cold ocean waters • Renewables represent a great opportunity for Hawaii but what about for the rest of the United States?
HYDROELECTRIC POWER • Electricity generated by using gravitational potential energy to power a turbine-generator • Two utility applications • Conventional hydroelectric generation • Energy storage by pumping water to upper reservoir during electric surplus and releasing it through a turbine-generator when needed • Two approaches for conventional hydro • Dams create a reservoir • Run of river depends on diverting river flow
LARGE SCALE CONVENTIONAL HYDROELECTRIC GENERATION • Output depends on time of year and precipitation • Future sites in the US are limited to none because of strong public resistance • Impacts • Water resources: stream flows, water temp. • Effects on fish migrations • Damage to archaeological/historic sites • Loss of scenic/wilderness resources • Upstream deposition (silting) & downstream erosion • Increased landslide potential • Gain in recreation resources • DOE forecast a net decline in hydro generation (see chart following)
FUTURE OF MINIHYDRO? • Small, low impact units: 1-2 MWe • Advanced controls permit integration into a distributed network • May reactivate some sites abandoned in the 1960s • Active in Japan and the Phillipines • Net impact in the US probably low
HYDROELECTRICITY IN CALIFORNIA • About 15% of California’s in-state generation is from hydroelectric (vs. 7% nationally) • Substantial imports of hydropower from the Pacific Northwest sensitive to precipitation and salmon migrations • Total of 386 hydroplants with 14,116 MWe capacity • Future large installations in California are unlikely
POWER FROM TIDES AND CURRENTS • Technical approaches • Tidal dams (barrages) • Tidal fences • Turbine fields • Common features • Depend on water driven fans/turbines • Low operating costs if can avoid biofouling and storm damage • High construction costs • Known or suspected negative impacts on marine environment
TIDAL BARRAGES • Dams across estuaries with gates and turbines • Tidal differences must be more than 16 feet—there are about 40 such sites in the world • Gates are opened when tide is high enough allowing water to flow through hydroturbines • La Rance a 240 MWe facility in France has operated reliably for many years • No facilities in the US—possibilities in the Pacific Northwest and the Atlantic Northeast • Cause silting, destroy wetlands and interfere with fish migrations • Probably limited potential for the US
TIDAL FENCES • Look like giant turnstiles • Span channels and spin in tidal currents • Current must be at least 5 to 8 knots • Density of sea water permits extracting much more energy from these than from corresponding wind mills
AXIAL FLOW TIDAL TURBINES • Arrayed in rows like wind farms • Look like wind turbines • Ideally close to shore in water depths of 60-100 ft. • Estimated costs of 5 MWe free-flow turbine installation (2005 dollars) • Capital cost $4300/KWe • Operating cost $.07-.09/KWH • Deployable 2010-2012
CROSS FLOW TURBINES • Like those for tidal gates • Use conduits to concentrate the tidal flow • Raised during incoming tide • Lowered to generate power during tidal ebb
CROSS FLOW TURBINECONDUIT PLUS RESERVOIRTIDAL OR WAVE ENERGY
POTENTIAL FOR TIDAL TURBINES IN US • Tidal locations (120): 1200 MWe • Riverine locations: 12,500-170,000 MWe • Gulf Stream: 685,000 MWe • Fragmented industry with no major industrial firms • Demonstration in 2006: Manhattan’s East River, 6 turbines, 35 rpm, 200 KWe by Verdant Power • For discussion see: Proceedings of the Hydrokinetic and Wave Energy Technologies Technical and Environmental Issues Workshop Oct. 26-28, 2005 http://hydropower.inl.gov/
WAVE ENERGYTECHNICAL APPROACHES • Floats or pitching devices: wave action moves two or more bodies relative to one another—various devices generate power; energy storage in supercapacitors since voltage/current are wildly erratic • Oscillating water columns: wave action drives air in and out of column—power is generated by an air turbine in the column • Wave surge or focusing devices: wave action drives water up a channel into a reservoir—power is generated by hydro turbines during outflow from reservoir
WAVE ENERGY POTENTIAL • Designs range from distributed generation to large scale power plants • Susceptibility to storm damage and biofouling are issues • Power conditioning and grid connection are also issues • EPRI estimate: at 60 m off US coast the average wave power is 2100TWH/Year • Could generate 7% of current US electricity demand by capturing 20% of the total wave energy at 50% efficiency.
PROBLEMS PREVENTING REALIZATION OF POTENTIAL • Both wave and tide technologies are largely unproven • DOE has no R&D capacity for them • The firms involved are small and undercapitalized • The regulatory structure is poorly defined • There are no tax credits for wave/tide power
WIND POWER • The most promising near term renewable resource • Issue: what will happen when the subsidies vanish? • US installed capacity growing at about 25% per year • Intermittent, irregular supply: • Value depends on installed capacity, site specific capacity factor, and timing of generation (e.g. summer generation is usually more valuable than winter generation) • At greater than 20% of a grid’s supply, managing the grid becomes difficult and expensive
SOME GENERAL ATTRIBUTES • Best sited where there is a reliable strong wind: the US midwest and southwest • Adaptable to either centralized (wind farm) or decentralized siting • Used by utilities to save fuel—not reliable baseload generation • Siting issues: Long Island, Nantucket/Martha’s Vineyard • Aesthetics/visibility: NIMBY • Noise • Electromagnetic interference • Banned within 1.5 miles of shipping or ferry lanes • Wild life fatalities: California, West Virginia • Low flying, migratory song birds (Altamount Pass) • Bats
TECHNOLOGIES • Horizontal axis fans are the best proven technologies • Windmills have been in use in the West since the Middle Ages • New designs are proliferating • Technical issues • Mechanisms are complex and expensive to maintain • Large blades for efficient units are expensive to make and transport • Power conditioning and grid connection issues seem to be resolved
VERTICAL SHAFT TURBINES • Compared to horizontal axis turbines • Greater efficiency: 45% vs. 25-40% • Operate in higher winds: 70 mph vs. 50 mph maximum • Quieter and less visibly intrusive • More readily scaled up in size: to 10 MWe vs. 5MWe maximum • Unproven technology at large scale
WIND POWER: EXAMPLES • Upstate New York: Maple Ridge • Leeward of Lake Ontario • Largest project east of the Mississippi: 195 turbines, 320 ft high, 320 MWe (peak) • Generate lease payments to landowners: $5000-$10,000 per turbine annually • Cost ~$1700 per KWe (peak) [2005 dollars] • Financed by Goldman Sachs • Subsidized by surcharge on utility bills • US installed capacity (2004) 6740 MWe (peak)
WINDPOWER POTENTIAL FOR THE UNITED STATES • Battelle estimated that with constraints wind can provide 20% of US electricity demand • DOE goal 6% of US demand by 2020 • Unconstrained estimate is that the US potential is equivalent to operating ~1500 1000 MWe nuclear or coal plants • Of the 50 states North Dakota has the greatest potential followed by Texas, Kansas, South Dakota, Montana and Nebraska—California is 17th • North Dakota could supply 25% of the current US electricity demand but would require a major growth of electricity transmission capacity.
WINDPOWER PROSPECTS • A big potential market: worldwide capacity is growing at 30% per year • Annual equipment sales ~ $2Billion in 2005 • Project financing for renewables in 2005 • Windpower $3.5 Billion • Solar Photovoltaic $2.2 Billion • All Other $1.25 Billion • Growing at 25% per year • Major companies are involved • General Electric • British Petroleum • Goldman Sachs • J P Morgan Chase • Siemens AG
GEOTHERMAL POWER • Employs geothermal heat directly (buildings, greenhouses, etc.) or to generate electricity • Electricity generation requires source temperatures > 300º F • Three basic plant designs • Dry steam: uses steam directly from reservoir w/o recycling: cost $.04-.06 per KWH • Flash steam: partially flashes superheated water (> 360º F) to steam and recycles the rest • Binary cycle: Reservoir fluid and working fluid kept separate—able to use lower temperature fluids (225-260º F): cost $.05-.08 per KWH
SOME SITE SPECIFIC RESERVOIR CHARACERISTICS • Fluid temperature and production rate • Corrosive nature of fluids • Co-production of noxious gases • Difficulty of drilling reservoir rock • Rate of replenishment of fluids and heat • Reservoir plugging due to mineralization or rock deformation • Access to maintenance and electric transmission
RESOURCES: ACTUAL AND POTENTIAL • Geothermal wells/springs (> 130º F) are widely distributed in the Western US (see map) • US currently generates 3000 MWe and uses 570 MWt from geothermal sources • Research efforts • Resource characterization • Plant efficiencies • Geothermal field development