Download
1 / 15
150 likes | 281 Views
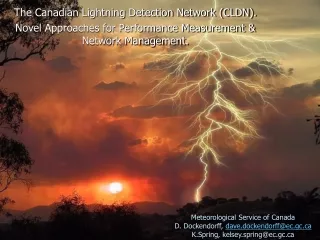
Cloud Lightning from the National Lightning Detection Network (NLDN). Ronald L. Holle, Nicholas Demetriades, and Martin Murphy Vaisala, Inc. Tucson, Arizona. Outline.

E N D
Cloud Lightningfrom the NationalLightningDetection Network(NLDN) • Ronald L. Holle, Nicholas Demetriades, and Martin Murphy • Vaisala, Inc. • Tucson, Arizona
Outline -- Value of LF cloud data-- Overview of LF cloud data-- Spatial representation of lightning activity-- Validation of LF cloud performance
Low frequency (LF) cloud data in the NLDN • Low frequency (LF) cloud lightning is typically located near cloud-to-ground (CG) lightning • Cloud lightning precedes CGs in ~70% of all thunderstorms • Cloud lightning typically precedes CGs by several minutes, but can precede CGs by > 60 minutes in some severe thunderstorms • Cloud flash rates are typically 3 times larger than CG flash rates, but may be >10 times larger in some severe thunderstorms
Outline -- Value of LF cloud data -- Overview of LF cloud data-- Spatial representation of lightning activity-- Validation of LF cloud performance
Low frequency (LF) cloud lightning data in theNational Lightning Detection Network (NLDN) • Activated April 2006 to all users • Detection methods are based on independent validation studies • Weak positive cloud-to-ground (CG) flashes less than +15kA are now identified as cloud flashes, not as CGs • 1/3 of the NLDN datastream is now LF cloud • A network configured for optimal detection of CGs on a national level will not detect most LF cloud flashes
The main challenge for LF cloud lightning detection:Source signal strengths All cloud Large cloud CG The median LF large cloud pulse amplitude is 5% as strong as for CGs A network configured for optimal detection of CGs on a national level will not detect most LF cloud flashes
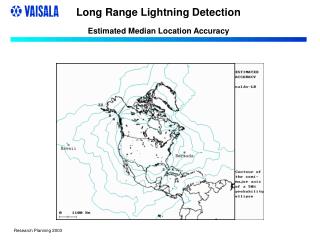
LF cloud data - NLDN • The vertical component of the cloud flash is located with a median accuracy of 500 meters • Cloud data are available in both the CG flash and CG stroke datastreams • A fraction of all cloud flashes that occur can be detected by the NLDN - the detection efficiency (DE) is typically 5-15% with the standard sensor spacing of the NLDN • LF cloud does not provide mapping of cloud lightning
Outline -- Value of LF cloud data -- Overview of LF cloud data-- Spatial representation of lightning activity-- Validation of LF cloud performance
LF cloud lightning detection data - Flash level Dallas- Fort Worth region Blue: Total VHF lightning mapping (1190 sources) Red: LF cloud lightning (5 sources)
Green: NLDN CG flashes - Sources at storm levelRed: NLDN-based test network LF cloud sources LF cloud flashes are typically located near the flash initiation point Dallas- Fort Worth region 18-minute period
VHF total lightning mappingAreal coverage of flashes at the storm level Dallas- Fort Worth region 18-minute period
Outline -- Value of LF cloud data -- Overview of LF cloud data-- Spatial representation of lightning activity-- Validation of LF cloud performance
The main challenge for LF cloud lightning detection:Source signal strengths All cloud Large cloud CG The median LF large cloud pulse amplitude is 5% as strong as for CGs A network configured for optimal detection of CGs on a national level will not detect most LF cloud flashes
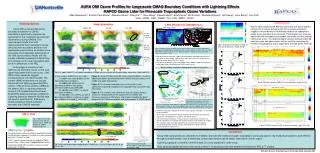
LF cloud validation with LDAR II VHF mapping networkIsolated storms,Dallas/Fort Worth, close NLDN spacing Date Storm LDAR NLDN LF Relative Modeled flashes cloud DE (%) DE (%) 01 May 04 A 431 72 17% 15-25% 01 May 04 B 91 35 38 25-30 01 May 04 C 275 101 37 25-30 13 May 04 39 9 23 25-30 DE = detection efficiency
The end Photo by James Gluba, Bloomington, IL