Download
1 / 30
300 likes | 438 Views
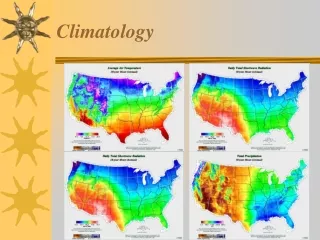
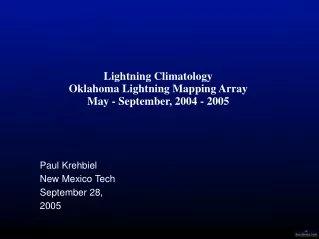
Matthew Bloemer Daniel Waller Eureka WFO 5/6/10. Eureka Lightning Climatology. What to Cover . Outline. Background & Motivations What is the Need for this Research Data Constraints , Caveats to Research Details about the NLDN Research Contributions

E N D
Matthew Bloemer Daniel Waller Eureka WFO 5/6/10 Eureka Lightning Climatology
What to Cover Outline • Background & Motivations • What is the Need for this Research • Data Constraints, Caveats to Research • Details about the NLDN • Research Contributions • Lightning Density and Frequency. • By Region • By Month of the Year, Time of the Day • Contributing Environmental Factors • Storm Relative Flow • Thermodynamic Considerations
Previous Topic Research Need for the Research - Previous research examined lightning frequency on a national basis (Orville & Huffiness 2002) Scales of lightning density have lacked quality of definition for the western region. • Lightning remains as a primary cause of wildfires in the west. (Rorig and Ferguson 2002) -Several previous studies have shown traditional convective indices to be insufficient for the west. i.e. HLTT Research (Milne 2004)
NCDC Data Characteristics (Current Network Precision Values) • Data comes from the National Lightning Detection Network (NLDN) • Archive recently made available to NWS employees for research purposes (previously only real time data) • Records each individual Cloud-to-Ground Flash • Data available back to 1986 • Data for each flash includes: • Time of Occurrence (1 Millisecond Temporal Resolution) • Latitude/Longitude (500 meter Spatial Resolution) • Flash Current (signed as positive or negative) • Multiplicity (# of return strokes per flash) • Number of detectors observing a strike.
History of the NLDN… • Inconsistencies in data from year to year make pure quantitative comparison troublesome • Largest benefit is in identifying high impact, large outbreaks Flash Stroke Stroke Since the early 1980’s the NLDN under constant development and refinement
Southwest Lightning Density Encompasses 1994 - 2008 Shows Monsoonal Dominated Patterns to the South Terrain Driven Events in North and Central California Minima ~ 1 lightning strike in 100 yrs / sq km. (Monterey, Marin, and Humboldt Counties)
Northern California Key Features Local Maxima Areas South Fork Mountain ridge / YollaBolla Trinity Tip / Siskiyou Mount Shasta Lassen/Modoc Central Sierra Crest Shasta County Relative Maxima (Wintertime Dominated)
Winter Months Transition Season has two regimes of lightning patterns 1 Coastal lightning from cold core systems over the ocean December Maxima 2 Central Valley… Storms initiate over terrain Intensify over warmer surfaces Northern Central Valley has some lightning throughout the winter (Shasta Co. Maxima) Convergence of low level Southerly winds at as they are funneled by terrain
Summer Months April has the lowest Warm Season Lightning Frequency May/September have Similar Frequencies May – Dynamic Sept- Thermodynamic July is the peak in activity June and August have similar overall frequencies June - Coastal August – Inland Tip of Trinity County… Same frequency June to July
Geographic Comparison Summer Months Only To further compare lightning occurrences over coastal regimes and inland regimes. KMFR Sample Zone KREV Sample Zone Temporal Occurrences of Lightning Time of day Month of year
Geographic Comparison Temporal Comparison Nocturnal lightning more prevalent in coastal areas Peak in afternoon lightning occurs 2 hours later at in the KMFR zone than in the KREV zone
Geographic Comparison Temporal Comparison • Nocturnal lightning more prevalent in coastal areas • Peak in afternoon lightning occurs 2 hours later at in the KMFR zone than in the KREV zone • Peak in monthly lightning activity occurs in July in both regimes… • KMFR Ramps up very quickly • KREV’s season is prolonged in to August
Wind Direction Comparison Summer Months Only Evaluation of summer daytime lightning May - September 11 am - 8pm PST . Correlated all lightning that occurred on a given day to the prevailing storm motion at the nearest sounding location Assumes the storm motion is valid over the entire zone Winds < 5 kts considered Calm Calculated the density of all lightning that occurred for a given wind direction Divided by the number of lightning days to normalize a density for a given wind direction Units are Strikes Per 100 Square km per event
WEST WINDS Number of cases 130 Average Wind Speed (kts) 11.9 Max Wind Speed (kts) 5.0 Min Wind Speed (kts) 31.6
SOUTHWEST WINDS Number of cases 185 Average Wind Speed (kts) 14.7 Max Wind Speed (kts) 33.9 Min Wind Speed (kts) 5.1
SOUTH WINDS Number of cases 95 Average Wind Speed (kts) 13.4 Max Wind Speed (kts) 27.5 Min Wind Speed (kts) 5.3
SOUTHEAST WINDS Number of cases 31 Average Wind Speed (kts) 14.5 Max Wind Speed (kts) 30.9 Min Wind Speed (kts) 5.4
EAST WINDS Number of cases 11 Average Wind Speed (kts) 10.8 Max Wind Speed (kts) 22.8 Min Wind Speed (kts) 5.2
NORTH WINDS(NE to NW) Number of cases 128 Average Wind Speed (kts) 11.9 Max Wind Speed (kts) 30.1 Min Wind Speed (kts) 5.1
CALM WINDS Number of cases 76 Average Wind Speed (kts) 3.4 Max Wind Speed (kts) 5.0 Min Wind Speed (kts) 0.3
WEST WINDS Number of cases 93 Average Wind Speed (kts) 14.2 Max Wind Speed (kts) 41.6 Min Wind Speed (kts) 5.0
SOUTHWEST WINDS Number of cases 186 Average Wind Speed (kts) 15.5 Max Wind Speed (kts) 50.8 Min Wind Speed (kts) 5.0
SOUTH WINDS Number of cases 60 Average Wind Speed (kts) 19.1 Max Wind Speed (kts) 47.9 Min Wind Speed (kts) 5.5
SOUTHEAST WINDS Number of cases 23 Average Wind Speed (kts) 11.3 Max Wind Speed (kts) 5.3 Min Wind Speed (kts) 5.0
EAST WINDS Number of cases 10 Average Wind Speed (kts) 10.0 Max Wind Speed (kts) 15.3 Min Wind Speed (kts) 1.0
NORTH WINDS(NE to NW) Number of cases 47 Average Wind Speed (kts) 12.6 Max Wind Speed (kts) 38 Min Wind Speed (kts) 6.5
CALM WINDS Number of cases 54 Average Wind Speed (kts) 3.3 Max Wind Speed (kts) 4.9 Min Wind Speed (kts) 0.63
HLTT Evaluation Thermodynamic Considerations
HLTT Evaluation Thermodynamic Considerations
Thank You! Questions?? Suggestions?