Download
1 / 54
560 likes | 774 Views
Characteristics of Positive Cloud-to-Ground Lightning. Scott D. Rudlosky Department of Meteorology Florida State University. Outline. Introduction Provide necessary background information on cloud-to-ground (CG) lightning. National Lightning Detection Network (NLDN) data

E N D
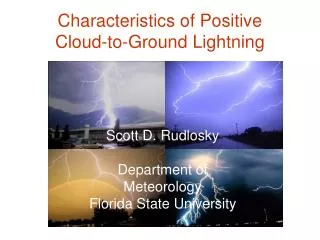
Characteristics of Positive Cloud-to-Ground Lightning Scott D. Rudlosky Department of Meteorology Florida State University
Outline • Introduction • Provide necessary background information on cloud-to-ground (CG) lightning. • National Lightning Detection Network (NLDN) data • Describe tools and methods used for measuring CG lightning. • Results • Large scale distribution • Regional distributions • Misclassification of cloud pulses • Summary and Conclusions • Future Work
Cloud-to-Ground (CG) Lightning • Injuries and fatalities • Structural damage • Buildings • Trees • Utility lines • Communications systems www.lightningsafety.noaa.gov
Stroke vs. Flash vs. Strike • A lightning flash can consist of one or more individual (return) stokes. • Multiplicity = # of return strokes. • A lightning strike is the point where CG lightning impacts the ground. • A single CG flash can be responsible for more than one lighting strikes. • Return strokesdo not always follow the same channel to the ground. Johnny Autery Ron Holle (Oro Valley, AZ)
Positive CG (+CG) Lightning • Positive charge lowered from cloud to ground. • First identified by Berger (1967) in Mount San Salvatore, Lugano, Switzerland. • Account for ~10% of CG lightning globally (Uman 1987). • Percentage varies by • Season • Geographical region • Individual storm • Greatest counts of +CG in the contiguous U.S. occur in Florida (Orville and Huffines 2001)
+CG Lightning • Dispatchers at Florida Power and Light Corporation (FP&L) have observed that damage to their facilities is often associated with +CG lightning. • +CG lightning also has been considered for its role in the initiation of forest fires. • The apparent increased damage is linked to physical characteristics of +CG lightning. • Greater peak current • Smaller multiplicity (fewer return strokes) • Long continuing current (LCC)
+CG Physics • +CG is characterized by Rakov (2003); • Greatest recorded lightning currents • Largest charge transfer to the ground • +CG flashes usually consist of a single stroke, whereas ~80% of –CG flashes contain two or more (Rakov 2003). • Positive return strokes tend to be followed by continuing currents that last for tens to hundreds of milliseconds (Rust et al. 1981). • Continuing currents of +CG are at least an order of magnitude greater than –CG (Brook et al. 1982).
Long Continuing Current (LCC) • LCC associated with +CG typically follows the first stroke. • However, LCC also occurs between strokes in multiple return stroke +CG or –CG flashes (Ron Holle, personal communication). • Image depicts LCC from multiple return stroke event. • LCCs occur between each of the strokes (faint glow between return strokes). Ron Holle (Holle Meteorology and Photography, Oro Valley, AZ)
+CG Lightning in Severe Storms • Storms with > 25% +CG account for less than 10 – 20% of all warm season severe storms in the eastern and southeastern U.S. (Carey and Buffalo 2007). • Some severe storms can produce > 90% +CG for short periods of time (Price and Murphy 2003; Biggar 2002). • Local mesoscale environment can influence the polarity of CG lightning by controlling a storm’s structure, dynamics, and microphysics (Carey and Buffalo 2007).
Charging Mechanism • Non-inductive charging mechanism (NIC) occurs as cloud particles of varying size and phase collide in the charging zone (Saunders et al. 1991). • Larger graupel or hail particles carry negative charge to the lower levels. Classical Thunderstorm • Updraft carries positively charged ice crystals to the upper levels (Saunders et al. 1991). • Image obtained from Krehbiel (1986).
+CG Mechanisms Tilted Dipole (Tripole) • Classical thunderstorms contain a dipole with positive charge over negative. • Electrical structure of deep convection is more complex with three or more significant charge layers (Stolzenburg et al 1998). Precipitation Unshielding Inverted Dipole (Tripole)
+CG Mechanisms • Highly sheared environments lead to the advection of upper-level positive charge (Brook et al 1982). • Positive charge is then exposed to the ground. • Explains +CG occurring in the anvil region. • Advection of charge also helps explain +CG lightning that occurs in the stratiform region. Tilted Dipole (Tripole)
+CG Mechanisms • Highly sheared environments lead to the advection of upper-level positive charge (Brook et al 1982). • Positive charge is then exposed to the ground. • Explains +CG occurring in the anvil region. • Advection of charge also helps explain +CG lightning that occurs in the stratiform region. Tilted Dipole (Tripole)
+CG Mechanisms • After most of the heaviest precipitation has fallen from a cell, the upper positive charge is exposed to the ground. • Abundance of positive charge is dependent on the duration and severity of an individual storm (Carey and Buffalo 2007). • Explains +CG which occurs in the dissipating stage of thunderstorms. Precipitation Unshielding • Severe storms can accumulate a large reservoir of positive charge (Carey and Buffalo 2007).
+CG Mechanisms • NIC mechanism is dependent on temperature, liquid water content (LWC), and collision velocity between particles. • Under certain conditions, the riming graupel and/or hail particles are positively charged while smaller ice crystals are negatively charged (Saunders et al. 1991). • Explains some of the +CG occurring in the region of deepest convection and heaviest precipitation. Inverted Dipole (Tripole)
Inverted Dipole (Tripole) • Mesoscale environments can influence the polarity of +CG within individual thunderstorms (Carey and Buffalo 2007). • Higher cloud base • Smaller warm cloud depth • Greater conditional instability • Greater buoyancy in the mixed phase zone • Drier middle to lower troposphere • Under these conditions, broad strong updrafts lead to larger LWC in the mixed phase zone and greater collision velocity, and in turn, the aforementioned modifications to the NIC mechanism (i.e. positive charge at low levels).
Seasonal Variability • +CG comprises a larger percentage of total CG during the cold season months (Engholm 1990). • Greater wind shear • Smaller warm cloud depth • The tendency is for +CG in more shallow convective regions, whereas –CG is more prevalent in deep convection. • This can be observed in bi-poles of individual thunderstorms. • During the warm season in Florida, the lower to middle levels are moist, reducing the relative number of +CG flashes.
Lightning Data • CG lightning data were collected by the National Lightning Detection Network (Vaisala Inc.). • Network consists of 113 sensors across the contiguous U.S. • Began full time operation in 1989. • Early applications included • Directing spotter aircraft • Electric utilities • Insurance industry • General aviation community • Due in part to changing users and their specific needs, major upgrades were undertaken in 1994-1995 and again in 2002- 2003. Jerauld et al. 2005
1994-1995 Upgrade • Goals (Grogan 2004) • Report strokes in addition to flashes • Improve location accuracy • Increase percentage of CG flashes detected • Report the peak current of CG flashes • Results (Grogan 2004, Cummins 2006) • Flash detection efficiency (DE) of 80-90% • 500 meter location accuracy • Performance decreases near edges of the network • This upgrade represented a major improvement.
2002-2003 Upgrade • Goals • Provide enhanced DE • Improve location accuracy • Increase network reliability • Detect some cloud flashes • Results • Increased stroke DE from 40-50% to 60-80% • Provided flash DE of 90-95% • Jerauld et al. (2005) conducted a rocket triggered lightning study at Camp Blanding, FL from 2001-2003 and found: Cummins 2006 • Stroke DE near 100% for peak current (Ip) > 30 kA • Stroke DE 60-70% for 10 < Ip < 30 kA • Stroke DE < 30% for 5 < Ip < 10 kA • Peak current underestimate of ~18%
2002-2003 Upgrade • Only data since 2002 were used in this study. • Prior to the most recent upgrade, it was suggested that all +CG flashes with Ip < 10 kA be removed because they were likely cloud pulses that were misclassified as weak positive flashes. • A post upgrade study by Biagi et al. 2007 noted • “Clearly there is no unique threshold for classifying a small-positive report as a CG stroke, but and Ip of +15 kA appears to be the value where the number of false CG reports equals the number of correct reports”. • The more recent threshold (+15 kA) is used for this study. • Little is known about the characteristics of these misclassified weak positive events.
Goals • Previous studies have shown Florida to be the “lightning capital” of the U.S. • Describe the characteristics of CG Lighting in Florida. • Annual flash densities are highly variable. • Describe variations in +CG and total CG flash densities across the state of Florida. • No previous studies have compared the multiplicity and peak current by month and region in Florida. • Describe regional and monthly variability in these characteristics. • Investigate characteristics of apparently misclassified NLDN events (10 kA < Ip < 15 kA).
Procedures • Current study analyzed 5 yrs of CG data 2002-2006. • 5 years of data are not sufficient to develop a true climatology. • However, using years prior to 2002 was inappropriate. • Flash densities were computed on a 2x2 km grid utilizing geographic information system (GIS) techniques. • GIS provides a common spatial domain for computing flash densities and statistics (e.g. percentage positive). • Flash densities have units of flashes km-2 season-1 (warm and cold) and flashes km-2 year-1 (annual). • Warm season consists of May – September, while cold season is the remaining months.
Analysis and Results Photo: Kane Quinnell Photo: Anonymous
Statistics for Entire Domain • Composite months (i.e. January 2002, 2003, 2004, 2005, and 2006). • Statistics for +CG are compared with those of total CG.
Annual Total CG Flash Densities Orlando Area Tampa / Saint Petersburg Region Miami / West Palm Beach Corridor
Annual +CG Flash Density Maximum Tallahassee / Apalachicola Region
Regional Distribution • The percentage of CG flashes that are positive varies by region and season. Percentages of +CG are • Greatest during the cold season • Generally greater in the northwestern region and decrease southward along the peninsula
Regional Distribution • Actual +CG flash counts are more beneficial when accessing the threat which +CG poses. • Percentage of +CG is highly dependent on the total number of CG flashes. • Percentages and counts are within 100 km of sounding locations in Jacksonville, Tampa and Miami. Composite Positive Flash Counts
Regional Distributions Composite Mean Multiplicity Composite Median Peak Current Note the different scales for each figure.
Regional Distributions – Peak Current Note the different scales for each region.
Daily Variability Note the different scales for each month and region.
NLDN Performance • Sensors are more closely spaced in the Southeast U.S. and especially Florida. • Closer spacing results in the detection of more weak positive events, and apparently more cloud pulses. Jerauld et al. 2005
Misclassification of Cloud Pulses • Prior to the 2002-2003 upgrade, a threshold of +10 kA was recommended. Afterwards, the threshold was changed to +15 kA. • “The (small) population of positive discharges between 10-20 kA are a mix of CG and cloud discharges” (Cummins et al. 2006). • This population is far from small during the warm season in Florida.
Misclassification of Cloud Pulses • Larger median peak current and smaller multiplicity of +CG occur during the cold season (consistent with previous studies). • However, during the warm season, +CG flashes are characterized by smaller median peak current and greater multiplicity. • Further research is needed to more accurately classify weak positive events.
Unusual Characteristics • The increase in +CG mean multiplicity has not been accounted for in previous studies. • Side flashes responsible for the “bolt from the blue” are not always positive.
Summary and Conclusions • Maximum annual flash density of 28.1flasheskm-2 year-1. • Warm season maxima total CG flash densities were located in • The Tampa / Saint Petersburg region • The greater Orlando area • Between Lake Okeechobee and the Atlantic Ocean • Cold season flash densities show a tendency toward the Northwestern portion of the domain.
Summary and Conclusions • Percentage of +CG was found to vary by season • Maximum during January of 13.59 % • Minimum during July of 2.41 % • +CG flashes showed • Minimum mean multiplicity of ~1.4 during the cold season • Maximum median peak current of ~35 kA during the cold season • Maximum mean multiplicity of ~1.7 during the warm season • Minimum median peak current of ~20 kA during the warm season • -CG flashes showed • Mean multiplicity fairly consistent throughout the year. • Maximum median peak current of ~18 kA during the warm season • Minimum median peak current of ~12 kA during the spring time.
Conclusions and Future Work • March was characterized by episodic occurrence of CG, while July had almost daily lightning. • On a given day, there is more +CG in Jacksonville than Miami. • Predicting this daily variability is the long term goal of the current research. • Sounding parameters will be linked to the percentage of +CG within 100 km radii of sounding locations in Jacksonville, Miami, Tallahassee, and Tampa. • Isolate better methods for distinguishing between in-cloud and cloud-to-ground events.
Acknowledgments • Prof. Henry E. Fuelberg • Encouragement, confidence, and guidance • Committee Members • Dr. Phil Cunningham • Dr. Mark Bourassa • Mr. Irv Watson • The Fuelberg Lab • John Sullivan, Jeremy Halland, Steven Martinaitis • Geoffrey Stano, Dr. Phillip Shafer • Ron Holle (Vaisala Inc.) • The Rudlosky Family • Parents Bill and Carol • Siblings Mark, Julie, and Kevin
References • Berger, K., 1967: Novel observations on lightning discharges: Results of research on Mount San Salvatore. J. Franklin Inst.,283, 478–525. • Biagi, C. J., K. L. Cummins, K. E. Kehoe, and E. P. Krider, 2007: National lightning detection network (NLDN) performance in southern Arizona, Texas, and Oklahoma in 2003-2004. J. Geophys. Res., 112, D05208, doi:10.1029/2006JD007341. • Biggar, D. G., 2002: A case study of positive strike dominated supercell thunderstorm that produced an F2 tornado after undergoing a significant cloud-to-ground lightning polarity shift. Nat. Wea. Digest. • Brook, M. Nakano, and P. Krehbiel, 1982: The electrical structure of the Hokuriku winter thunderstorms. J. Geophys. Res.,87 (C2), 1207–1215. • Carey, L. D., and S. A. Rutledge, 1998: Electrical and multiparameter radar observations of a severe hailstorm. J. Geophys. Res.,103, 13,979 – 14,000. • ____, L. D., S. A. Rutledge, and W. A. Petersen, 2003b: The relationship between severe storm reports and cloud-to-ground lightning polarity in the contiguous United States from 1989–98. Mon. Wea. Rev., 131, 1211–1228. • ____, L. D., and K. M. Buffalo, 2006: Environmental control of cloud-to-ground lightning polarity in severe storms. Mon. Wea. Rev., 135, 1327-1353. • Cummins, K. L., M. J. Murphy, E. A. Bardo, W. L. Hiscox, R. B. Pyle, and A. E. Pifer, 1998: A combined TOA/MDF technology upgrade of the U.S. National Lightning Detection Network. J. Geophys. Res.,103 (D8), 9035–9044. • ____, K. L., J.A. Cramer, C.J. Biagi, E.P. Krider, J. Jerauld, M. Uman, and V. Rakov, 2006: The U.S. National Lightning Detection Network: Post-upgrade status. 2nd Conferenceon the Meteorological Applications of Lightning Data, Amer. Meteor. Soc., Atlanta, GA, January 30 – 31, 2006, Paper 6.1.
References • ____, K. L., 2006: The interdependence of lightning detection technology and applications: A historical look at the U.S. National Lightning Detection Network. Intl. Conf. on Grounding and Earthing & 2nd Intl. Conf. on Lightning Physics and Effects, Maceio, Brazil, November. • Engholm, C. D., E. R. Williams, and R. M. Dole, 1990: Meteorological and electrical conditions associated with positive cloud-to-ground lightning. Mon. Wea. Rev., 118, 470-487. • Fuquay. D. M., 1982: Positive cloud-to-ground lightning in summer thunderstorms. J. Geophys. Res.,87, 7131-7140. • Grogan M. J., 2004: Report on the 2002-2003 U.S. NLDN® System-wide Upgrade. Vaisalanews,165, 4-8. • Lang, T. J. and co-authors, 2004: The Severe Thunderstorm Electrification and Precipitation Study. Bull. Amer. Meteorol. Soc., 85, 1107-1126. • Laing, A. G., and co-authors, 2001: Wildfire forecasting in Florida. COMET Outreach Program. [Available online at http://www.comet.ucar.edu/outreach/abstract_final/ 9918115.htm.] • Lericos, T. P., H. E. Fuelberg, A. I. Watson, and R. L. Holle, 2002: Warm season lightning distributions over the Florida peninsula as related to synoptic patterns. Wea. Forecasting,17, 83-98. • Orville, R.E., and G.R. Huffines, 2001: Cloud-to-ground lightning in the United States: NLDN results in the first decade, 1989– 1998. Mon. Weather Rev., 129, 1179– 1193. • Price, C., and B. Murphy, 2003: Positive lightning and severe weather. Geophys. Res. Abstracts, 5, 3339. • Rakov, V. A., M. A. Uman, and R. Thottappillil, 1994: Review of lightning properties from electric field and TV observations. J. Geophys. Res., 99, 10745-10750.
References • ____, V. A., 2003: A review of positive and bipolar lightning discharges. Bull. Amer. Meteor. Soc., 767-776. • Rust, W. D., D. R. MacGorman, and R. T. Arnold, 1981: Positive cloud-to-ground lightning flashes in severe storms. Geophys. Res. Lett.,8, 791-794. • ____, W. D., 1986: Positive cloud-to-ground lightning. The Earths Electrical Environment, E. P. Krider and R. Roble, Eds, National Academy press, 41-45. • ____, W. D., and D. R. MacGorman, 2002: Possibly inverted-polarity electrical structures in thunderstorms during STEPS. Geophys. Res. Lett.,29, 10.1029/2001GL014303. • Saunders, C. P. R., W. D. Keith, and R. P. Mitzeva, 1991: The effect of liquid water on thunderstorm charging. J. Geophys. Res.,96, 11 007-11 017. • ____, C. P. R., and S. L. Peck, 1998: Laboratory studies of the influence of the rime accretion rate on charge transfer during crystal/graupel collisions. J. Geophys. Res.,103, 13 949–13 956. • Shafer, P. E., and H. E. Fuelberg, 2006: A statistical procedure to forecast warm season lightning over portions of the Florida peninsula. Wea. Forecasting, 21, 851-868. • ____, P. E., and H. E. Fuelberg, 2007a: A perfect prognosis scheme for forecasting warm season lightning over Florida. Part I: Model Development. Submitted to Mon. Wea. Rev. • ____, P. E., and H. E. Fuelberg, 2007b: A perfect prognosis scheme for forecasting warm season lightning over Florida. Part II: Model Evaluation. Submitted to Mon. Wea. Rev.
References • Stolzenburg, M., 1994: Observations of high ground flash densities of positive lightning in summertime thunderstorms. Mon. Wea. Rev.,122, 1740–1750 • Uman, M. A., 1987: The Lightning Discharge. Academic Press, 377 pp. (Reprinted by Dover, 2001.) • Westcott, N. E., 1995: Summertime cloud-to-ground lightning activity around major Midwestern urban areas. J. Appl. Meteor.,34, 1633-1642. • Wiens, K. C., S. A. Rutledge, and S. A. Tessendorf, 2005: The 29 June 2000 supercell observed during STEPS. Part II: Lightning and charge structure. J. Atmos. Sci., 62, 4151-4177. • Williams, E. R., 1989: The tripole structure of thunderstorms. J. Geophys. Res.,94, 13 151-13 167. • Wilson, C. T. R., 1920: Investigations on lightning discharges and on the electric field of thunderstorms. Philos. Trans. Roy. Soc. London, 221A, 73-115. • Zajac, B. A., and S. A. Rutledge, 2001: Cloud-to-ground lightning activity in the contiguous United States from 1995-1999. Mon. Wea. Rev., 129, 99-1019.
Questions or Comments? Self-portrait during the last ~ month and a half.