Download
1 / 31
320 likes | 599 Views
ENERGY TRADING IN THE SOUTHERN AFRICAN POWER POOL Alison Chikova Chief Engineer March 2009 Durban, South Africa. CONTENTS. Introduction to SAPP History of Inteconnections Bilateral Energy Trading Short Term Energy Market Trading Day Ahead Market Trading Trading Platform Functions.

E N D
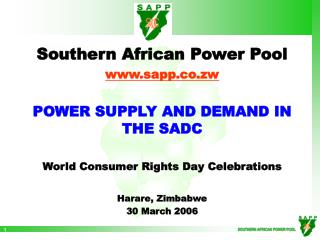
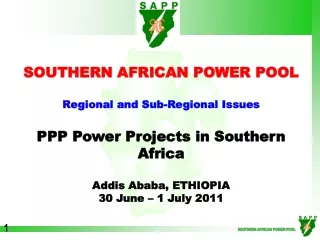
ENERGY TRADING IN THE SOUTHERN AFRICAN POWER POOL Alison Chikova Chief Engineer March 2009 Durban, South Africa
CONTENTS Introduction to SAPP History of Inteconnections Bilateral Energy Trading Short Term Energy Market Trading Day Ahead Market Trading Trading Platform Functions
INTRODUCTION TO THE SAPP DR Congo Tanzania Angola Malawi Zambia Zimbabwe Namibia Mozambique Botswana Swaziland South Africa Lesotho Geographic • 12 Countries • 230 Million people • Average Electricity growth rate 3% p.a. • For South Africa demand growth was 4.9% in 2007 and for whole region 4.6%.
DRC Tanzania Malawi Angola Zambia Zimbabwe Namibia Mozambique Botswana Swaziland South Africa Lesotho Historic 1950s: DRC – Zambia 500 kV HVDC -1700km 1960s: Zambia – Zimbabwe 330 kV at Kariba Dam (Zambezi River) 1975: Mozambique – South Africa 533 kV HVDC – 1400 km
Hydro Northern Network DRC Tanzania Malawi Angola Zambia Zimbabwe Namibia Mozambique Botswana Swaziland Thermal Southern Network South Africa Lesotho HISTORIC
Kenya H Gabon Congo Nairobi Dem Rep of Congo Rwanda Burundi Brazzaville SAPP Membership Kinshasa Tanzania H H Dar es Salaam • Angola • Botswana • DRC • Lesotho • Mozambique • Malawi • Namibia • Tanzania • South Africa • Swaziland • Zambia • Zimbabwe H H Luanda H Angola Malawi Zambia Mozambique H Lilongwe H H Lusaka H H H H T H H H Harare H H T H Namibia H Zimbabwe Botswana T H Windhoek T Gaborone T T H Pretoria T T Maputo T T T T T T Johannesburg Mbabane T T Swaziland T P H Lesotho South Africa H Hydro station H Pumped storage scheme P N Cape Town Thermal Station P T
74.3% Coal 20.1% Hydro 4.0% Nuclear 1.6% Gas/Diesel 1.5.2 Generation Mix
80.4% South Africa 5.0% Mozambique 4.1% Zimbabwe 3.6% Zambia 2.6% DRC 4.4% Rest 1.5.3 COUNTRY CONTRIBUTION INSTALLED CAPACITY
SAPP Vision The SAPP Vision is to: • Facilitate the development of a competitive electricity market in the Southern African region. • Give the end user a choice of electricity supply. • Ensure that the southern African region is the region of choice for investment by energy intensive users. • Ensure sustainable energy developments through sound economic, environmental & social practices.
SADC-DIS Executive Committee RERA Management Committee Markets Sub-Committee Operating Sub-Committee Planning Sub-Committee Environmental Sub-Committee Coordination Centre Board Coordination Centre SAPP Management & Governance Structure Management Structure and Governance Structure
Council Integrated Council of Ministers Committee of Senior Government Officers Directorate of Infrastructure and Services SAPP SAPP Reporting Protocol
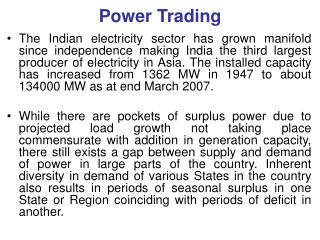
TRADING ARRANGEMENTS Rationale for Power Trading • Some countries in the SAPP have excess Generation Capacity, others have deficit: • The result is energy flow between member countries in form of energy trading. • Northern network is predominantly hydro and Southern network thermal: • Good generation mix that mitigates drought • Members share in the resulting benefit.
BILATERAL CONTRACTS • Takes up 90-95% of energy trade: 15 - 20 TWh • Peak and standard times. • STEM • The short-term energy market (STEM) was introduced in April 2001 • Precursor to full competition • Caters for 5-10% of energy trade: 0.8 – 4.3 TWh • Daily and hourly contracts • Off-peak periods • Competitive Market Development • Development of competitive market in the form of a Day-ahead Market (DAM) started in 2003. • The SAPP is also developing an Ancillary Services Market and a Balancing Mechanism.
BILATERAL CONTRACTS • Can be firm on non-firm contracts • Non-firm contracts: • Are interruptible with notice • If notice given, no penalties • Generally less than 75% reliable. • Firm contracts: • Most have attached reliability premium • Penalties for non-delivery applies.
PREVIOUSLY FUTURE • Bilateral contracts • Bilateral contracts • Day-Ahead Market (DAM) – From 2008 • Ancillary Services Market – From 2010 • Balancing Mechanism – From 2010 CURRENT • Bilateral contracts • Short-Term Energy Market (STEM) - 2001 • Post STEM (Balancing Market) - 2002 POWER TRADING EVOLUTION
THE SAPP COMPETITIVE MARKET Goals and Methodology GOALSof the SAPP DAM design: • Establish an efficientand competitive marketplace • Ensure that consumersbenefit from the market METHODOLOGY: • Development of consistent market mechanisms. • Efficientprice signals for the procurement and transmission of electricity. • Assurance of fair and open access to the transmission system. • Optimization of generation & transmission capacity.
Day Ahead Market … • Market place for secure, effective and non-discriminatory trade of electricity • Trading conducted daily for delivery next day • Forward bidding up to ten days • Participants submit (purchase) bids and (sale) offers • Only market operator and participant know their own bids • Provides a neutral reference price • Price discovery • Over-time provides reference for bilateral contracts • Market Clearing Price (MCP) valid for all trades
DAM Design Principles • Market type • Auction type market • Participants bid into market for all 24 hrs of next/future day. • Bidding • Participants submit both purchase & sale bids. • Types of bids:Single hourand Block bids. • Bid areas • Multiple bid areas with configurable transmission capacities between areas.
Price calculation • At defined time, market closes & Market Clearing Price (MCP) calculated. • MCP is price where supply equals demand without taking transmission constraints into consideration. • Congestion Management • Calculated contract flow between bid areas computed & compared with available transmission capacity for spot trade. • In case of congestion, market splitting performed, and local area prices calculated. • Auction results • Participants receive area prices with associated volume. Multiple currencies.
CHALLENGES IN POWER TRADE • Limited transmission capacity leads to congestion. • Lack of monitoring system at SAPP Coordination Centre to trace transactions (contracts). • Adherence to schedules leading to inadvertent energy.
OPPORTUNITIES IN POWER TRADE • Regional market diverse. • Optimal use of regional resources. • Generation mix consists of hydro / thermal. • Correct price of electricity in the Pool determined. • Send signals for investment for power generation and transmission projects. • Enables demand side to respond to supply side signals.
STARTUP CHALLENGES • Challenges experienced by SAPP at start of the pool: • Language of communication • Local languages • Foreign languages - English, French or Portuguese? • Dispute resolution • How will disputes be resolved? • Who will be the referee? • Harmonisation Issues • Different legal frameworks • Different technical standards
OPERATIONAL CHALLENGES • Competitive or Co-operative pool • SAPP is moving from cooperative to competitive pool. • Power sector reforms taking place in member countries at the same time as the SAPP transition – Uncertainty? • SAPP governance and membership • Settlement • Cost allocation of SAPP budget to members • Delays in membership fee settlements • Regional and Individual Priority Projects • What is a priority project and what criteria should be used to define it? • What is a regional project? • Reduction in generation capacity – what next?
Transmission Projects DRC 2010: Mozambique Malawi Tanzania 2011: DRC - Zambia Malawi Angola Zambia 2014: Zambia - Tanzania Zimbabwe 2010 -2011: ZIZABONA Namibia Mozambique Botswana 2012 -2014: WESTCOR Swaziland 2015: EASTERN CORRIDOR Lesotho South Africa
TUNISIA MOROCCO ALGERIA LIBYA EGYPT MAURITANIA MALI ERITERA NIGER SENEGAL DJIBOUTI TCHAD GAMBIA SUDAN GUINEE-BISSAU GUINEE NIGERIA BENIN ETHIOPIA SIERRA LEONE COTE D’IVOIRE GHANA TOGO RCA LIBERIA CAMEROUN SOMALIA GUINEE EQ. OUGANDA KENYA CONGO SAO TOME & PRINCIPE GABON R. RD CONGO B. COMELEC TANZANIA COMORES WAPP ANGOLA CAPP MALAWI ZAMBIA EAPP (+ RDC, Rwanda , Burundi) MOZAMBIQUE ZIMBABWE MADAGASCAR NAMIBIA BOTSWANA SAPP RSA SWAZILAND LESOTHO INTERCONNECTING POWER POOLS IN AFRICA BURKINA FASO POWER POOLS IN AFRICA