Download
1 / 14
140 likes | 386 Views
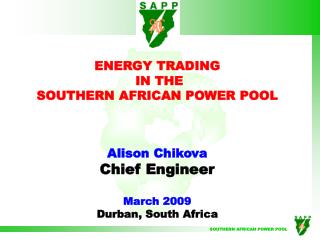
Southern African Power Pool www.sapp.co.zw POWER SUPPLY AND DEMAND IN THE SADC World Consumer Rights Day Celebrations Harare, Zimbabwe 30 March 2006. CONTENTS. STATUS OF POWER SUPPLY REASONS FOR INCREASE IN POWER DEMAND SAPP RECOMMENDATIONS SELECTED REGIONAL PROJECTS CONCLUSION.

E N D
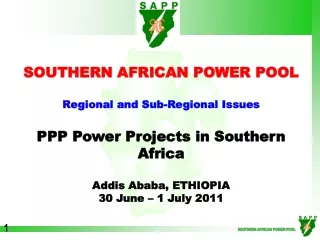
Southern African Power Pool www.sapp.co.zw POWER SUPPLY AND DEMAND IN THE SADC World Consumer Rights Day Celebrations Harare, Zimbabwe 30 March 2006
CONTENTS STATUS OF POWER SUPPLY REASONS FOR INCREASE IN POWER DEMAND SAPP RECOMMENDATIONS SELECTED REGIONAL PROJECTS CONCLUSION
TABLE-1: SAPP POWER SUPPLY AND DEMAND 2004 Peak Net Capacity Installed Capacity Country Utility Demand [MW] [MW] [MW] 590 ENE Angola 742 317 120 BPC Botswana 132 402 70 LEC Lesotho 72 70 261 ESCOM Malawi 305 271 EDM Mozambique 307 2,250 HCB 2,075 274 390 NamPower Namibia 393 470 36,208 Eskom South Africa 42,011 34195 50 SEB Swaziland 51 172 480 TANESCO Tanzania 591 508 1,170 SNEL DRC 2,442 993 1,630 ZESCO Zambia 1,632 1295 ZESA Zimbabwe 1,990 1,825 2069 TOTAL 52,743 45,044 41,036 Status of Power Supply in the SADC
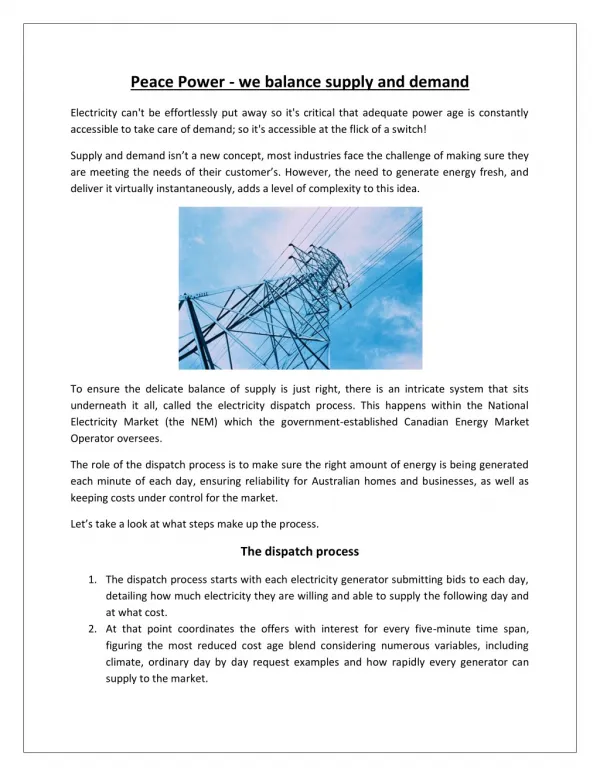
Reasons for Increase in Power Demand in the SADC • Power demand in the SAPP has been increasing at a rate of about 3% per year caused by: • Increased economic activity • Establishment of energy intensive users • Non-economic tariffs • Electrification programs • No significant investment in generation in the last 10-years. • If nothing is done (no new generation project) then, it is anticipated that in the year 2007, the SAPP will run out ofgeneration surplus capacity. • Challenge for SAPP is to keep pace with rising demand.
The SAPP Planning Data is indicating that SAPP runs out of generation surplus capacity after the year 2007.
SAPP Recommendations • Political support to the SAPP initiatives on generation expansion is required. • Short-term generation facilities must be constructed by 2007, if system reliability is to be maintained. • The SADC region should come up with ways of marketing and attracting investment into generation & transmission projects. • Create suitable environment for investment in member countries by addressing regulation and cost reflective tariffs.
Selected Regional Projects SAPP Projects currently in progress
Committed - Rehabilitation - Short Term 72000 68000 64000 60000 MW 56000 52000 48000 44000 40000 36000 2005 2006 2007 2008 2009 2010 2011 2012 2013 2014 2015 2016 2017 2018 2019 2020 Year Capacity Planned Peak Demand with DSM + Reserve
Kenya H Gabon Congo Nairobi Dem Rep of Congo Rwanda Burundi Brazzaville Kinshasa Tanzania H H Dar es Salaam H H Luanda H Angola Malawi Zambia Mozambique H Lilongwe H H Lusaka H H H H T H H H Harare H H T H Namibia H Zimbabwe Botswana T H Windhoek T Gaborone SOUTHERN AFRICAN GRID T T H Pretoria T T Maputo T T T T T T Johannesburg Mbabane T T Swaziland T P H Lesotho South Africa H Hydro station H Pumped storage scheme N P Cape Town Thermal Station P T
Conclusions The challenges for the SAPP are: • Reverse the diminishing generation surplus capacity the region is experiencing. • Creation of an enabling environment for investors to invest in generationand transmission infrastructure. • Embracing of the principle of cost reflective tariffs and the adoption of regulatory principles to enhance those tariffs. THANK YOU