Temporal Evolution of Boundary Layer Components in High Ozone Episodes
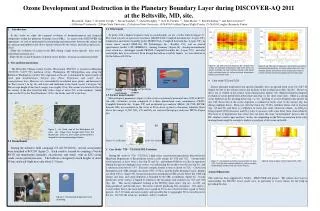
This study explores the temporal evolution of thermodynamic and chemical components within the planetary boundary layer during high ozone episodes. The goal is to understand the interactions between the surface and the atmosphere in a rural/urban transition area. Data from the Beltsville Climate Center System Observation in Maryland are analyzed using various instruments. Results show ozone dynamics influenced by atmospheric conditions. Sponsored by NASA DISCOVER AQ project.

Temporal Evolution of Boundary Layer Components in High Ozone Episodes
E N D
Presentation Transcript
2.2 Tethersonde. To probe with a higher frequency than an ozondesonde, we use a tether balloon (figure 3) . The sonde consists of a pressure transducer (ModelCS106, Campbell Scientific Inc., Logan, UT), temperature and relative humidity probe (HMP155A-L, Campbell Scientific Inc., Logan, UT), an ozone sensor (model OEM-106, 2B Technologies Inc., Boulder, CO), and an aerosol spectrometer (model 1.109, GRIMM Co., Ainring, Germany) (figure 3b). Analog measurements were stored in a datalogger (model CR200X, Campbell Scientific Inc., Logan, UT), and after each flights data were retrieved. Even though the balloon could fly higher, we were allowed to fly the balloon till 200 m. Figure 3: Inside of the tethersonde and the balloon. 2.3 Surface measurements. Meteorological parameters (figure 4a) have been continuously measured since 2003 at BCCO. An eddy covariance system comprised of a three dimensional sonic anemometer (CSAT3, Campbell Scientific Inc., Logan, UT) and an infrared gas analyzer (IRGA) (LI-7500, LICOR, Lincoln, NE) was mounted on the tower at 28 m above ground to determine turbulent fluxes above the canopy. O3 NO, NO2, CO, and SO2 are measure through gas analyzers TECOs (Figure 4b). Figure 4: (a) Micrometerological tower set up (b) Gas analyzers rack.. Case Study: 7/20 – 7/23/2011 PBL Evolution. During the week of 7/20 -7/23/2011 a high ozone concentration episode has been observed. Maryland Department of Environment issued a code orange for 7/20 and 7/21. Ozonesondes were launched, at least, twice a day (fig 5b and 5c), and tethered balloon was also in operation. During this period a high pressure system was influencing the weather over the site (fig 5a), and a stationary front left on 7./19 . The next synoptic frontal system occurred on 7/26. Convective Boundary Layer (CBL) heights are about 1500 – 1750 m, and the Stable Boundary Layer heights are about 500 m (figure 5b). Ozone mixing ratios maximum in CBL are just below the CBL top during day time, and ozone depletion is bounded by the SBL at nighttime (figure 6c) . Ozone production at the surface is lagged in relation to the incoming solar radiation on 7/21 and 7/22 (fig.. 6d). This can be explained looking at the NO/NO2 times series (fig 6e). As NO are being produced, and the Sun rises, NO reacts with O3 producing NO2 (nitration). NO source s is more likely due to the local traffic since a peak in CO is also observed when a peak of NO is present. On 7.20 winds are more easterly, and, possibly due to topography NO is not advected to the site. On 7/23 the winds are northerly and it is weekend. 4. Case study 7/22 and 7/29. Surface potential temperature and specific humidity show an upward trend from 7/21 till 7.23 (figure 5e) due to the storage of heat and moisture in the residual layer (RL) (fig 5b). However, this is not so evident in the surface ozone mixing ratios (figure 6d). Higher resolution temporal evolution of ozone profile from tethersondedata (fig. 7a, 8a) show some clues. There is a strong ozone depletion in the morning hours (fig. 7a, 7b). Looking to a more detailed ozone profile on day 7/29 shows that at the ozone depletion is confined at levels close to the surface (fig. 8a) during nighttime hours. Then, just after the dawn (fig. 7b 8b), turbulent fluxes start to increase (fig. 6d and 7d), and there is a depletion of ozone into entire observed column. As [NO2] is being formed, [NO] decreases and [O3] starts to increase, with some delay from solar radiation. This lead us to hypothesize that ozone does not have the same “accumulation” procces due to RL, similar to water vapor and heat. In this site, depending on the NO concentration in the early morning hours might be enough to deplete a good part of the ozone in the RL. Acknowledgements: This work has been supported by NASA – DISCOVER AQ project. The authors also want to acknowledge the BCCSO ozone sonde crew, in particular to Cassie Sterns for her help in providing the data. Tethered Sonde Introduction: In this study we study the temporal evolution of thermodynamical and chemical components within the planetary boundary layer (PBL). As a part of the DISCOVER AQ experiment, we seek to understand the relationship and interactions between the surface and the adjacent atmospheric layer that is directly affected by the surface and surface processes. Goals: - Study the evolution of scalars in the PBL during a high ozone episode days over a rural/urban transition area. - Study the decay and formation of diurnal ozone profiles, focusing on transition periods. Site and Instrumentation. The Beltsville Climate Center System Observation (BCCSO) is located in Maryland (39.054°N; 76.877 °W), northeast of the Washington, DC Metropolitan area, along the Baltimore-Washington corridor. The vegetation at the site is dominated by mixed stands of sweet gum (Liquidambar), Virginia pine (PinusVirginiana), and maple (Acer seudoplatanus) trees. However, it is surrounded by residential areas, plants, and factories to the West (sector 1 in fig 1b), and forest and farmlands at the South (sector 3 in figure 1b). The average height of the forest canopy was roughly 19 m. The terrain was relatively flat in the vicinity of the flux tower but hilly with a slope of about 10% to the northeast. Major roads are the 95 to the West/Northwest, 495 to the South, and 295 to the East. 2.1 OzoneSonde During the intensive field campaign (7/1 till 7/31/2011), several ozonesondes were launched at BCCSO (figure 2) . Each sonde is formed by coupling a Vaisala RS-92 (air temperature, humidity, air pressure, and wind) with an ECC ozone sonde (ozone partial pressure). The balloon is designed to reach heights of about 15 km, and each flight may take about 2-3 hours. Ozone analyzer Aerosol spectrometer (a) (a) (b) (b) (c) (c) (d) (d) (e) (e) Figure 5: (a) Time series of pressure; (b) vertical cross section of potential temperature with wind barbs; (c) specific humidity; (d) solar radiation (black), wind speed (red), and wind barbs; (e) surface potential temperature (black) and humidity (red). Figure 6: (a) Time series of pressure; (b) vertical cross section of potential temperature; (c) ozone mixing ratios; (d) solar radiation (black), and surface ozone mixing ratios (red); (e) surface potential temperature (black) and humidity (red). Ozone Development and Destruction in the Planetary Boundary Layer during DISCOVER-AQ 2011 at the Beltsville, MD, site.Ricardo K. Sakai (1), Everette Joseph (1), Kevin Sanchez (2), David Doughty (2), José D. Fuentes (2), John Moore (3), Ken Pickering (4) and Jim Crawford (5).(1) Howard University, (2)Penn State University, (3)Jackson State University, (4)NASA Goddard Space Flight Center, (5) NASA Langley Research Center (a) (b) (b) (a) Figure 1: (a) Road map of the Washignton DC area. (b) Image from Google Earth from the BCCSO site. Circle is a 2 Km radius whose center is located the micrometeorological tower. Figure 7: (a) temporal evolution ozone profiles for days 7/22 -7/23; (b) Solar radiation (black), O3 (red) at surface; (d) NO (black) and NO2 (red); (e) friction velocity . Figure 8: Same as figure 7, but for days 7/28 – 7/29. Figure 2: Ozonesonde preparation and launching