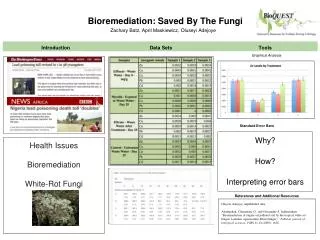
Lab 1: Make A Scatter Plot of Data with Error Bars
50 likes | 240 Views
Lab 2: Determine whether data set differences are statistically significant.. The second worksheet contains the data from Lab 1.Compute the standard score (Z) for the differences between each data set.Which of the data points cannot be shown to be different from the others with 95% confidenc

Lab 1: Make A Scatter Plot of Data with Error Bars
E N D
Presentation Transcript
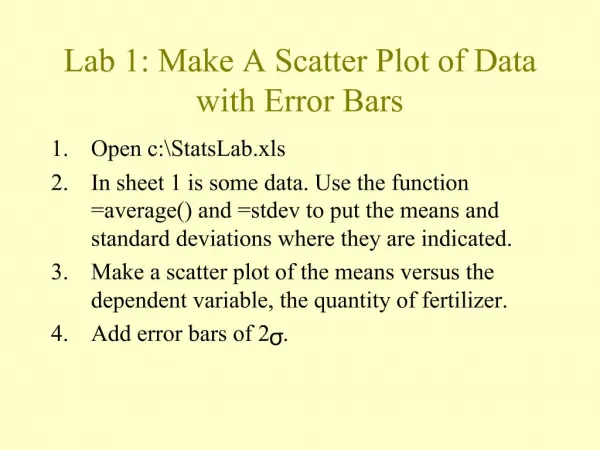
1. Lab 1: Make A Scatter Plot of Data with Error Bars Open c:\StatsLab.xls
In sheet 1 is some data. Use the function =average() and =stdev to put the means and standard deviations where they are indicated.
Make a scatter plot of the means versus the dependent variable, the quantity of fertilizer.
Add error bars of 2s.
2. Lab 2: Determine whether data set differences are statistically significant. The second worksheet contains the data from Lab 1.
Compute the standard score (Z) for the differences between each data set.
Which of the data points cannot be shown to be different from the others with 95% confidence?
3. Lab 3: Student�s T-Test In Lab 3, another, much smaller data set from another fertilizer is to be analyzed. Can it be concluded that the other fertilizer had a statistical effect on the growth?
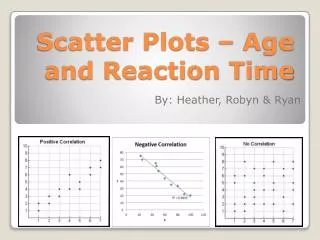
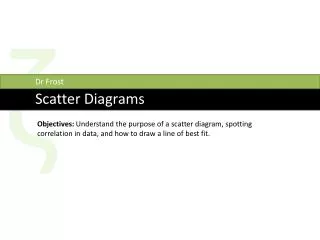
4. Lab 4: Determining Correlation Make a scatter plot of the hours studied versus exam score columns.
Find the correlation coefficient by using the function � >Insert >Function >Statistical >Pearson
Plot the linear least squares fit of the plot and the r2 value on the graph.
Determine how confident we can be that the phenomena are linked.
5. Lab 5: ?2 Analysis Wally likes to fish, rain or shine. Some days he catches fish and other days he doesn�t. Find out if there is a link between rainy days and Wally�s luck with the rod and reel. What is the probability of such an event occurring by accident?