Download
1 / 18
190 likes | 329 Views
Initial X-ray absorption spectroscopy measurements in LIGO mirror coatings* E. E. Doomes and S. C. McGuire Department of Physics, Southern University and A&M College Baton Rouge, Louisiana 70813 R. Tittsworth Center for Advanced Microstructures and Devices

E N D
Initial X-ray absorption spectroscopy measurements in LIGO mirror coatings* E. E. Doomes and S. C. McGuire Department of Physics, Southern University and A&M College Baton Rouge, Louisiana 70813 R. Tittsworth Center for Advanced Microstructures and Devices Louisiana State University and A&M College, Baton Rouge, Louisiana 70806 *Work supported by NSF Grant No. PHY-0101177. ---Talk presented at the LIGO Scientific Collaboration Meeting, Hanford, WA, August 13-17, 2005 LIGO-G050383-00-Z
Talk Outline • Motivation • Experiment • Data & Analysis • Results • Summary & Future Work
Objective: Obtain physical correlations between chemical impurities and/or dopants (Ti, Cr, Fe, Co, etc.) and optical absorption characteristics of materials under consideration for use as test masses andoptical coatingsin advanced LIGO.
SUBR Measurements Program X-ray Fluorescence (XRF)CAMD, SSRL, ALS Extended X-ray absorption CAMD fine structure (EXAFS) X-ray absorption near edge CAMD, SSRL spectroscopy (XANES) Neutron Activation Analysis (INAA) NIST Prompt Gamma Neutron Activation Analysis (PGNAA) NIST Neutron Depth Profiling (NDP) NIST Electron Spin Resonance (ESR) NIST
Coatings Samples Four (4) samples received June 23, 2005. Sample #1 300°C MLD Sample #3 Sample #4 Samples are ~9.5 mm SiO2 wedges with coatings.
Double Crystal Monchromator Beamline 13 element Ge photon detector array
X-ray fluorescence (XRF) Theory NX-rays = Natomss(E)f'(E)dE . [w(exp(-imidxi))eDT] (1) For a monoenergetic beam of energy, Eo , NX-rays = Natomss(Eo)f(Eo)w(exp(-imidxi))eDT (2) where NX-rays = number of background–subtracted X-rays Natoms= number of target atoms seen by the beam s = photoelectric cross section (cm2) w = fluorescence yield f = flux of incident X-rays (#/cm2.s) mi = linear attenuation coefficient(s) (/cm) dxi = Secondary X-ray pathlength(s) (cm) e = photopeak detection efficiency DT = detector live time (s)
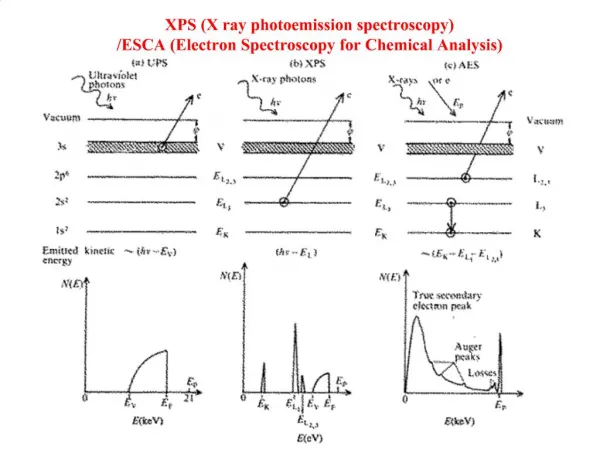
X-ray Absorption Spectroscopy Excitation of a specific core electron with monochromatic X-ray source Events prior to and subsequent to ejection of electron provide useful information about the system
XANES Theory A visual representation Outgoing photoelectron wave Backscattered wave • Interaction of waves from absorber and backscattering neighbor yield information on the system.
XANES Theory • The near edge region is dominated by multiple-scattering of the low kinetic energy photoelectron by neighboring atoms • Edge position is a function of oxidation state • Coordination and molecular orbitals influence peak shapes • Comparison with known spectra allows for ‘fingerprinting’ of samples
Information gained • The intensity of each uncorrected spectrum in the previous figure is an indicator of the amount of titanium present (fluorescence intensity is roughly proportional to # of titanium atoms present) • The shape of the spectrum is a function of the chemical state of the titanium (titanium oxide)
Results • In the experiments conducted thus far: • Clear signals for elements of primary interest (Ti and Ta) have beenobserved for samples 3 and 4. • Relative concentration of titanium in samples 3 & 4 has been estimated: Ti(S4)/Ti(S3) = 6.1 + 2.01 % (counting statistical uncertainty only). • These initial results are encourage a long-term program of measurements. • CAMD beamtime proposal is in preparation. • Measurements are applicable to the investigation of other dopant/substrate systems.
Summary & Future Work • Identified major coating components and some trace elements on surfaces. • Titanium is deposited as an amorphous oxide. • Future grazing incidence experiments will allow for selective examination of coating surface with reduced scatter from substrate. • Complementary X-ray diffraction studies are planned. • Simulations of spectra with FEFF code are ongoing.
Questions? and/or Discussion --- Talk presented at the 2005 LIGO Scientific Collaboration Meeting Hanford, WA, August 13-17, 2005