Download

1 / 60
2.07k likes | 5.41k Views
X-ray Photoelectron Spectroscopy (XPS) . Center for Microanalysis of Materials Frederick Seitz Materials Research Laboratory University of Illinois at Urbana-Champaign. Electron Spectroscopies XPS: X-ray Photoelectron Spectroscopy AES: Auger Electron Spectroscopy

E N D
X-ray Photoelectron Spectroscopy (XPS) Center for Microanalysis of Materials Frederick Seitz Materials Research Laboratory University of Illinois at Urbana-Champaign
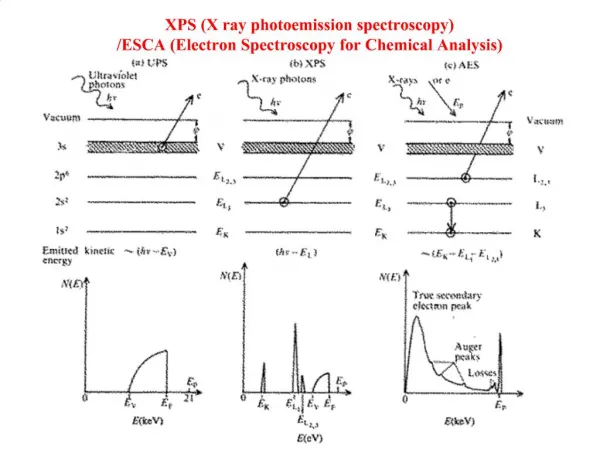
Electron Spectroscopies XPS: X-ray Photoelectron Spectroscopy AES: Auger Electron Spectroscopy EELS: Electron Energy Loss Spectroscopy Ion Spectroscopies SIMS: Secondary Ion Mass Spectrometry SNMS: Sputtered Neutral Mass Spectrometry ISS: Ion Scattering Spectroscopy Surface AnalysisThe Study of the Outer-Most Layers of Materials (<100 ).
Introduction to X-ray Photoelectron Spectroscopy (XPS) • What is XPS?- General Theory • How can we identify elements and compounds? • Instrumentation for XPS • Examples of materials analysis with XPS
What is XPS? X-ray Photoelectron Spectroscopy (XPS), also known as Electron Spectroscopy for Chemical Analysis (ESCA) is a widely used technique to investigate the chemical composition of surfaces.
What is XPS? X-ray Photoelectron spectroscopy, based on the photoelectric effect,1,2 was developed in the mid-1960’s by Kai Siegbahn and his research group at the University of Uppsala, Sweden.3 1. H. Hertz, Ann. Physik 31,983 (1887). 2. A. Einstein, Ann. Physik 17,132 (1905). 1921 Nobel Prize in Physics. 3. K. Siegbahn, Et. Al.,Nova Acta Regiae Soc.Sci., Ser. IV, Vol. 20 (1967). 1981 Nobel Prize in Physics.
X-ray Photoelectron SpectroscopySmall Area Detection Electrons are extracted only from a narrow solid angle. X-ray Beam X-ray penetration depth ~1mm. Electrons can be excited in this entire volume. 10 nm 1 mm2 X-ray excitation area ~1x1 cm2. Electrons are emitted from this entire area
The Photoelectric Process Ejected Photoelectron Incident X-ray Free Electron Level • XPS spectral lines are identified by the shell from which the electron was ejected (1s, 2s, 2p, etc.). • The ejected photoelectron has kinetic energy: KE=hv-BE- • Following this process, the atom will release energy by the emission of an Auger Electron. Conduction Band Fermi Level Valence Band 2p L2,L3 2s L1 1s K
Auger Relation of Core Hole Emitted Auger Electron Free Electron Level • L electron falls to fill core level vacancy (step 1). • KLL Auger electron emitted to conserve energy released in step 1. • The kinetic energy of the emitted Auger electron is: • KE=E(K)-E(L2)-E(L3). Conduction Band Fermi Level Valence Band 2p L2,L3 2s L1 1s K
XPS Energy Scale • The XPS instrument measures the kinetic energy of all collected electrons. The electron signal includes contributions from both photoelectron and Auger electron lines.
XPS Energy Scale- Kinetic energy • KE= hv - BE - spec • Where: BE= Electron Binding Energy • KE= Electron Kinetic Energy • spec= Spectrometer Work Function • Photoelectron line energies: Dependenton photon energy. • Auger electron line energies: Not Dependenton photon energy. • If XPS spectra were presented on a kinetic energy scale, one would need to know the X-ray source energy used to collect the data in order to compare the chemical states in the sample with data collected using another source.
XPS Energy Scale- Binding energy • BE = hv - KE - spec • Where: BE= Electron Binding Energy • KE= Electron Kinetic Energy • spec= Spectrometer Work Function • Photoelectron line energies: Not Dependent on photon energy. • Auger electron line energies: Dependenton photon energy. • The binding energy scale was derived to make uniform comparisons of chemical states straight forward.
Fermi Level Referencing Free electrons (those giving rise to conductivity) find an equal potential which is constant throughout the material. Fermi-Dirac Statistics: T=0 K kT<<Ef f(E) f(E) = 1 exp[(E-Ef)/kT] + 1 1.0 0.5 0 Ef 1. At T=0 K: f(E)=1 for E<Ef f(E)=0 for E>Ef 2. At kT<<Ef (at room temperature kT=0.025 eV) f(E)=0.5 for E=Ef
Sample/Spectrometer Energy Level Diagram- Conducting Sample e- Sample Spectrometer Free Electron Energy KE(1s) KE(1s) Vacuum Level, Ev spec sample hv Fermi Level, Ef BE(1s) E1s Because the Fermi levels of the sample and spectrometer are aligned, we only need to know the spectrometer work function, spec, to calculate BE(1s).
Sample/Spectrometer Energy Level Diagram- Insulating Sample e- Sample Spectrometer Free Electron Energy KE(1s) spec Vacuum Level, Ev Ech hv Fermi Level, Ef BE(1s) E1s A relative build-up of electrons at the spectrometer raises the Fermi level of the spectrometer relative to the sample. A potential Ech will develop.
Binding Energy Referencing • BE = hv - KE - spec- Ech • Where: BE= Electron Binding Energy • KE= Electron Kinetic Energy • spec= Spectrometer Work Function • Ech= Surface Charge Energy • Ech can be determined by electrically calibrating the instrument to a spectral feature. • C1s at 285.0 eV • Au4f7/2 at 84.0 eV
Where do Binding Energy Shifts Come From?-or How Can We Identify Elements and Compounds? Pure Element Fermi Level Binding Energy Electron-electron repulsion Look for changes here by observing electron binding energies Electron Electron-nucleus attraction Electron-Nucleus Separation Nucleus
Binding Energy Determination The photoelectron’s binding energy will be based on the element’s final-state configuration. Initial State Final State Free Electon Level Conduction Band Conduction Band Fermi Level Valence Band Valence Band 2p 2s 1s
The Sudden Approximation • Assumes the remaining orbitals (often called the passive orbitals) are the same in the final state as they were in the initial state (also called the frozen-orbital approximation). Under this assumption, the XPS experiment measures the negative Hartree-Fock orbital energy: • Koopman’s Binding Energy • EB,K -B,K • Actual binding energy will represent the readjustment of the N-1 charges to minimize energy (relaxation): • EB = EfN-1 - EiN
Binding Energy Shifts (Chemical Shifts) • Point Charge Model: • Ei = Ei0 + kqi + qi/rij EB in atom i in given refernce state Weighted charge of i Potential at i due to surrounding charges
Chemical Shifts- Electronegativity Effects Carbon-Oxygen Bond Oxygen Atom Electron-oxygen atom attraction (Oxygen Electro-negativity) Valence Level C 2p C 1s Binding Energy Core Level C 1s Shift to higher binding energy Electron-nucleus attraction (Loss of Electronic Screening) Carbon Nucleus
Electronic Effects- Spin-Orbit Coupling Ti Metal Ti Oxide
Final State Effects-Shake-up/ Shake-off Results from energy made available in the relaxation of the final state configuration (due to a loss of the screening effect of the core level electron which underwent photoemission). • Monopole transition: Only the principle quantum number changes. Spin and angular momentum cannot change. • Shake-up: Relaxation energy used to excite electrons in valence levels to bound states (monopole excitation). • Shake-off: Relaxation energy used to excite electrons in valence levels to unbound states (monopole ionization). L(2p) -> Cu(3d)
Final State Effects- Shake-up/ Shake-off Ni Metal Ni Oxide
Final State Effects- Multiplet Splitting Following photoelectron emission, the remaining unpaired electron may couple with other unpaired electrons in the atom, resulting in an ion with several possible final state configurations with as many different energies. This produces a line which is split asymmetrically into several components.
Electron Scattering Effects Energy Loss Peaks e*ph + e**solid eph + esolid Photoelectrons travelling through the solid can interact with other electrons in the material. These interactions can result in the photoelectron exciting an electronic transition, thus losing some of its energy (inelastic scattering).
Quantitative Analysis by XPS For a Homogeneous sample: I = NsDJLlAT where: N = atoms/cm3 s = photoelectric cross-section, cm2 D = detector efficiency J = X-ray flux, photon/cm2-sec L = orbital symmetry factor l = inelastic electron mean-free path, cm A = analysis area, cm2 T = analyzer transmission efficiency
Quantitative Analysis by XPS N = I/sDJLlAT Let denominator = elemental sensitivity factor, S N = I / S Can describe Relative Concentration of observed elements as a number fraction by: Cx = Nx / SNi Cx = Ix/Sx / S Ii/Si The values of S are based on empirical data.
Relative Sensitivities of the Elements 3d 4f 2p 4d 1s
Introduction to X-ray Photoelectron Spectroscopy (XPS) • What is XPS?- General Theory • How can we identify elements and compounds? • Instrumentation for XPS • Examples of materials analysis with XPS
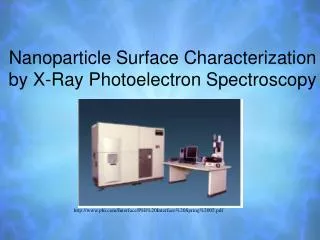
Instrumentation for XPS Surface analysis by XPS requires irradiating a solid in an Ultra-high Vacuum (UHV) chamber with monoenergetic soft X-rays and analyzing the energies of the emitted electrons.
Why UHV for Surface Analysis? Pressure Torr Degree of Vacuum • Remove adsorbed gases from the sample. • Eliminate adsorption of contaminants on the sample. • Prevent arcing and high voltage breakdown. • Increase the mean free path for electrons, ions and photons. 2 10 Low Vacuum -1 10 Medium Vacuum -4 10 High Vacuum -8 10 Ultra-High Vacuum -11 10
X-ray Photoelectron Spectrometer Computer System Hemispherical Energy Analyzer Outer Sphere Magnetic Shield Analyzer Control Inner Sphere Electron Optics Multi-Channel Plate Electron Multiplier Lenses for Energy Adjustment (Retardation) Resistive Anode Encoder X-ray Source Position Computer Lenses for Analysis Area Definition Position Address Converter Position Sensitive Detector (PSD) Sample
XPS at the ‘Magic Angle’ Orbital Angular Symmetry Factor LA (g) = 1 + bA (3sin2g/2 - 1)/2 where: g = source-detector angle b = constant for a given sub-shell and X-ray photon At 54.7º the ‘magic angle’ LA = 1
Electron DetectionSingle Channel Detector Step 1 2 3 Electron distribution on analyzer detection plane 2 Step 1 3 E1 E3 E1 E3 E1 E3 E2 E2 E2 Counts in spectral memory
Electron DetectionMulti-channel Position Sensitive Detector (PSD) Step 1 2 3 4 5 Electron distribution on analyzer detection plane Step 1 2 3 4 5 E1 E3 E1 E3 E1 E3 E1 E3 E1 E3 E2 E2 E2 E2 E2 Counts in spectral memory