Download
1 / 28
310 likes | 616 Views
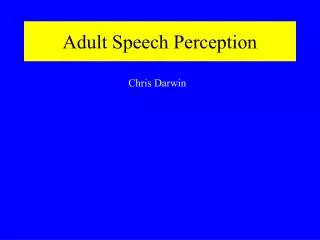
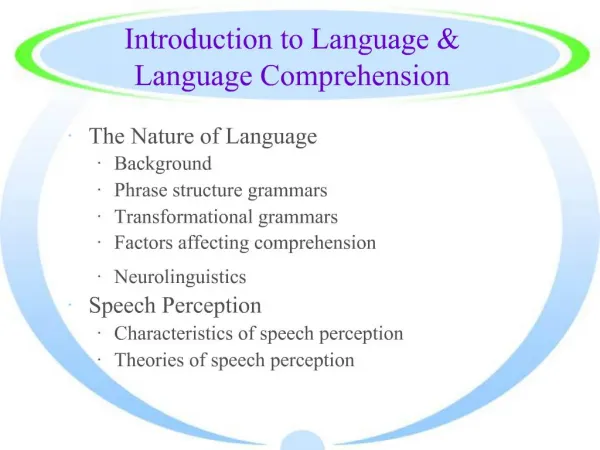
Language Comprehension Speech Perception Naming Deficits. Triangle Model. Thought / High-level understanding. Semantics meaning. Reading. Speech perception. Orthography text. Phonology speech.

E N D
Triangle Model Thought / High-level understanding Semantics meaning Reading Speech perception Orthography text Phonology speech Connectionist framework for lexical processing, adapted from Seidenberg and McClelland (1989) and Plaut et al (1996).
Speech Perception • The first step in comprehending spoken language is to identify the words being spoken, performed in multiple stages: 1. Phonemes are detected (/b/, /e/, /t/, /e/, /r/, ) 2. Phonemes are combined into syllables (/be/ /ter/) 3. Syllables are combined into words (“better”) 4. Word meaning retrieved from memory
Speech perception: two problems • Words are not neatly segmented (e.g., by pauses) • Difficult to identify phonemes • Coarticulation = consecutive speech sounds blend into each other due to mechanical constraints on articulators • Speaker differences; pitch affected by age and sex; different dialects, talking speeds etc.
How Do Listeners Resolve Ambiguity in Acoustic Input? • Use of context • Cross-modal context • e.g., use of visual cues: McGurk effect • Semantic context • E.g. phonemic restoration effect
Effect of Semantic Context • Pollack & Pickett (1964) • Recorded several conversations. • Subjects in their experiment had to identify the words in the conversation. • When words were spliced out of the conversation and then presented auditorily, subjects identified the correct word only 47% of the time. • When context was provided, words were identified with higher accuracy • clarity of speech is an illusion; we hear what we want to hear
Phonemic restoration Auditory presentationPerception Legislature legislatureLegi_lature legi latureLegi*lature legislature It was found that the *eel was on the axle. It was found that the *eel was on the shoe. It was found that the *eel was on the orange. It was found that the *eel was on the table. wheel heel peel meal Warren, R. M. (1970). Perceptual restorations of missing speech sounds. Science, 167, 392-393.
McGurk EffectPerception of auditory event affected by visual processing Demo 1 AVI: http://psiexp.ss.uci.edu/research/teachingP140C/demos/McGurk_large.avi MOV: http://psiexp.ss.uci.edu/research/teachingP140C/demos/McGurk_large.mov Demo 2 MOV: http://psiexp.ss.uci.edu/research/teachingP140C/demos/McGurk3DFace.mov Harry McGurk and John MacDonald in "Hearing lips and seeing voices", Nature264, 746-748 (1976).
McGurk Effect • McGurk effect in video: • lip movements = “ga” • speech sound = “ba” • speech perception = “da” (for 98% of adults) • Demonstrates parallel & interactive processing: speech perception is based on multiple sources of information, e.g. lip movements, auditory information. • Brain makes reasonable assumption that both sources are informative and “fuses” the information.
Models of Spoken Word Identification • The Cohort Model • Marslen-Wilson & Welsh, 1978 • Revised, Marslen-Wilson, 1989 • The TRACE Model • Similar to the Interactive Activation model • McClelland & Elman, 1986
Recognizing Spoken Words: The Cohort Model • All candidates considered in parallel • Candidates eliminated as more evidence becomes available in the speech input • Uniqueness point occurs when only one candidate remains
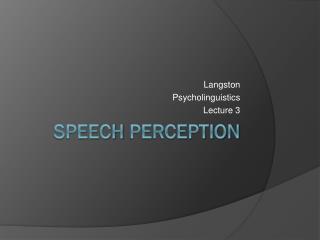
Analyzing speech perception with eye tracking ‘Point to the beaker’ Eye tracking device to measure where subjects are looking Allopenna, Magnuson & Tanenhaus (1998)
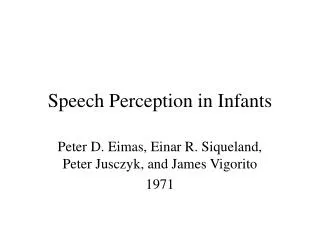
Human Eye Tracking Data Plot shows the probability of fixating on an object as a function of time Allopenna, Magnuson & Tanenhaus (1998)
TRACE: a neural network model • Similar to interactive activation model but applied to speech recognition • Connections between levels are bi-directional and excitatory top-down effects • Connections within levels are inhibitory producing competition between alternatives (McClelland & Elman, 1986)
TRACE Model Predictions (McClelland & Elman, 1986)
Representing Meaning • Mental representation of meaning as a network of interconnected features • Evidence comes from patients with category-specific impairments • more difficulty activating semantic representation for some categories than for others
Category Specific Semantic Deficits Patients who have trouble naming living or non-living things
Definitions giving by patient JBR and SBY Farah and McClelland (1991)
Explanation • One possibility is that there are two separate systems for living and non-living things • More likely explanation: • Different types of objects depend on different types of encoding perceptual information functional information
Representing Meaning Chapter 12
Sensory-Functional Approach • Category specific effects on recognition result from a correlated factor such as the ratio of visual versus functional features of an object • living more visual and nonliving more functional. • How do we know that? • Farah & McClelland (1991) report a dictionary study showing the ratio of visual to functional features: 7.7:1 for living things and 1.4:1 for nonliving things
A neural network model of category-specific impairments • A single system with functional and visual features. • Model was trained to associate visual picture with the name of object using a distributed internal semantic representation Farah and McClelland (1991)
A neural network model of category-specific impairments lesions lesions • Simulate the effect of brain lesions Farah and McClelland (1991)
Simulating the Effects of Brain Damage by “lesioning” the model Functional Lesions: selective impairment of non-living things Visual Lesions: selective impairment of living things Farah and McClelland (1991)