Download
1 / 24
240 likes | 367 Views
I-94 St. Michael to Rogers. Traffic Forecasting and Operational Analysis. 10/23/2013. Agenda. Introductions and Project Background Project Work Tasks Traffic Forecasts/Operations Results Existing Volumes and Operations Analysis Year 2035 No Build Forecasts

E N D
I-94 St. Michael to Rogers Traffic Forecasting and Operational Analysis 10/23/2013
Agenda • Introductions and Project Background • Project Work Tasks • Traffic Forecasts/Operations Results • Existing Volumes and Operations Analysis • Year 2035 No Build Forecasts • Year 2035 No Build Operations Analysis • Year 2035 Build Forecasts • Schedule
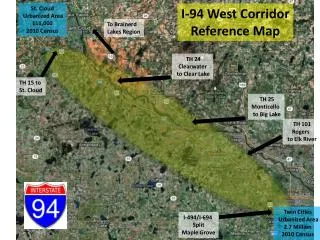
Project Background • I-94 currently experiences operational deficiencies between the TH 241 and TH 101 interchanges • Potential improvements to address these deficiencies include: • Auxiliary lanes between TH 241 and TH 101 • Six-lane section from TH 241 through TH 101
Project Work Tasks • Traffic Forecasts (SRF) • Traffic Analysis (SRF) • Traffic Documentation (SRF) • Benefit-Cost Analysis (SRF) • Noise Analysis (SRF) • Environmental Document (District 3) • Staff Approved Layout (District 3)
Existing Conditions • Traffic Volumes • Developed using volumes from the TH 610 model (2011) and current (2013) volumes provided by District 3 • Peak hour volumes from 2011 were 5-10 percent higher than 2013 counts • Volumes from 2011 are in the 95th percentile of all weekdays over the past year
Existing Conditions • Freeway model (CORSIM) from the TH 610 project was used as a base • Extended west to include the TH 241 interchange • Year 2011 traffic volumes from the TH 610 model were used along with supplemental data (2013) at the TH 241 interchange • Site visits were conduced in early October 2013 to obtain speed/travel time information and identify operational issues
Existing Conditions • Modeling Results and Observations • Operational Issues • EB I-94 Merge at TH 241 (AM Peak) • WB I-94 Merge at TH 101 (PM Peak) • LOS F and reduced speeds at both locations (35 to 45 mph) • Significant congestion on SB TH 101 (AM Peak) • Heavy right lane congestion with max queue over 1500 feet • U-Turns were made south of the interchange • WB TH 241 off ramp (PM Peak) • Approximately 35 seconds delay with max queue of 500 feet • It was observed that some vehicles would use the shoulder to make right and left turns (dual lefts)
Existing Conditions Travel Time Reliability Evaluation • Measures/Data Sources • Corridor Traffic Volumes (VMT) • Average Travel Times • Analysis Timeframe/Location • Every 5-minute period during 2012 • I-94 westbound from I-494 to TH 101
Year 2035 No Build Forecasts • Roadway Network Improvements • TH 610 connected between CSAH 81 and I-94 to/from the west • I-494 dynamic shoulder lanes between TH 55 and East Fish Lake Road • Interchange at Brockton Lane and 610 County Road Extension projects were NOT included • Land Use Assumptions • Consistent with approved community development totals and TH 610 modeling
Year 2035 No Build Forecasts 62,200 + 23,300 85,500 6,900 + 7,600 14,500 17,600 + 7,200 24,800 39,500 + 28,500 68,000 72,900 + 27,300 100,200 26,000 + 13,000 39,000 95,300 + 53,200 148,500 Existing + Growth 2035 No Build
Year 2035 No Build Forecasts 1,200 + 500 1,700 12,000 + 9,400 21,400 7,000 + 2,900 9,900 1,000 + 500 1,500 6,400 + 2,500 8,900 6,700 + 6,300 13,000 6,400 + 2,900 9,300 6,500 + 2,500 9,000 14,300 + 13,900 28,200 2,800 + 2,100 4,900 Existing + Growth 2035 No Build
Preliminary Year 2035 No Build Operations • Operational issues at similar locations as existing conditions • More delay and longer queues • EB I-94 merge at TH 241 (AM Peak) • LOS F and speeds of 20 mph • Queue spills back on I-94 to the end of the model (over 1 mile) • WB I-94 merge at TH 101 (PM Peak) • LOS F and speeds of 30-35 mph • Queue spills back on I-94 approximately ½ mile
Preliminary Year 2035 No Build Operations • SB TH 101 (AM Peak) • Significant congestion for the entire 3-hour model period with queues spilling back to the end of the model (over 1 mile) • I-94/TH 241 interchange (PM Peak) • WB ramp intersection will be over capacity • Queues exceed the length of the ramp, impacting I-94 mainline • Volumes indicate additional capacity is needed on the bridge even with improvements (i.e., dual lefts, loop)
Year 2035 Build Forecasts • Two Build Scenarios Evaluated • Auxiliary lanes between TH 241 and TH 101 • Extension of 6-lane capacity to TH 241 • Travel demand model did not show meaningful difference between scenarios • Only one build condition volume set was developed for both scenarios
Year 2035 Build Forecasts 85,500 + 4,000 89,500 14,500 +/- 0 14,500 24,800 + 2,000 26,800 68,000 - 1,000 67,000 100,200 + 11,000 111,200 39,000 + 1,000 40,000 148,500 + 3,000 151,500 2035 No Build + Growth 2035 Build
Year 2035 Build Forecasts 1,700 -1,000 700 21,400 - 400 21,000 9,900 + 2,400 12,300 1,500 -1,000 500 8,900 + 2,500 11,400 13,000 -1,200 11,800 9,300 + 2,400 11,700 9,000 + 2,500 11,500 28,200 - 600 27,600 4,900 - 1,000 3,900 2035 No Build + Growth 2035 Build
Year 2035 Build Forecasts System Benefits • VMT shift to freeway facilities • Reduction of vehicle-miles on local roadways • Total savings of 4,000 vehicle-hours/day
Schedule • Next Meeting – November 13, 2013 • Alternative Analysis • Preferred Alternative Discussion • Traffic Documentation - December 2014 • Noise Analysis – February 2014
Thank You Questions? Claudia Dumont – MnDOT District 3 Claudia.Dumont@state.mn.us Josh Maus – SRF jmaus@srfconsulting.com