Download
1 / 1
10 likes | 149 Views
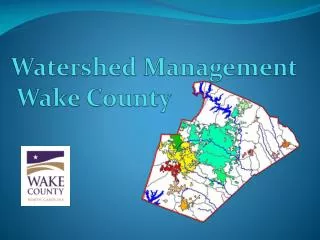
30 m. Soybean. 30 m. PSU Soybean. PSU Corn. Sorghum. PSU Small Grain. Small Grain. Corn. PSU Grass. Grass. Using SSURGO County-Level Soils Data with the SWAT Watershed Model.

E N D
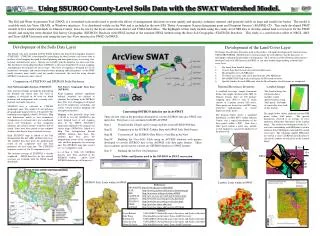
30 m Soybean 30 m PSU Soybean PSU Corn Sorghum PSU Small Grain Small Grain Corn PSU Grass Grass Using SSURGO County-Level Soils Data with the SWAT Watershed Model. The Soil and Water Assessment Tool (SWAT) is a watershed-scale model used to predict the effects of management decisions on water quality and quantity, sediment, nutrient, and pesticide yields on large and small river basins. The model is available with Arc-View, GRASS, or Windows interfaces. It is distributed widely on the Web and is included in the new EPA ‘Better Assessment Science Integrating point and Nonpoint Sources’ (BASINS) CD. This study developed SWAT models of five small watersheds in Johnson County, Iowa for use by the local conservation district and USDA field office. The highlights of this study include using the county-level NRI data to develop annual land cover layers for the SWAT model; and using the more detailed Soil Survey Geographic (SSURGO) Database with SWAT instead of the standard SWAT method using the State Soil Geographic (STATSGO) Database. This study is a corroborative effort of NRCS, ARS, and Texas A&M University staff using the new Arc-View interface for SWAT (AvSWAT). Development of the Soils Data Layer Development of the Land Cover Layer The Image Classification Procedure used in this study is still under development by Glenn Lawson, USDA/NRCS/NRIAI. The References section includes the web addresses for the data used. A detail paper outlining this procedure is forthcoming. Mr. Lawson used the following information to develop a land cover GIS layer for AvSWAT, or any other models/maps needing a current land cover layer. 1. Six bands from Landsat imagery. 2. Census Tiger data to mask out roads and urban areas 3. Broad landuse for each NRI point 4. The three-acre circle earth cover data from the 1992 NRI points 5. Iowa DNR/USGS Gap Analysis Program (GAP) broad cover/use 6. Specific landuse for each NRI point after the Broad landuse classifications are completed The default soils layer included with the SWAT model is the State Soil Geographic Database (STATSGO). STATSGO is developed by generalizing the detail county soils survey data to produce a level mapping designed for broad planning and management uses in covering state, regional, and multi-state areas. Options are available with the model to use other soils data. The Soil Survey Geographic Database (SSURGO) is the most detailed level of soils mapping, and duplicates the original soil survey maps. This level of mapping is designed for use by landowners, townships, and county natural resource planning and management. As the SWAT model becomes more widely used for smaller watersheds, the need for using detailed SSURGO soils data becomes critical. Comparison of STATSGO and SSURGO Soils Databases National Resources Inventory A stratified two-stage sample framework defines the sample structure of the NRI. In Johnson County, there are 256 primary sampling units (PSU’s), each of which consists of a quarter section (160 acres). Three points are located in each PSU using restricted randomization to ensure dispersion of the points. The diagram below shows a simulated distribution of NRI PSUs within Johnson County, and a typical distribution of the three points within a PSU. Note that a 30m² pixel around a point may include several landcovers, not just the landcover of the point itself. Landsat Image This Landsat image for for Eastern Iowa includes a multi- spectral analysis using 30m² pixels. Six bands of sensor data were used in this analysis. State Soil Geographic Database (STATSGO) State general soil maps are made by generalizing the detailed soil survey data. The level of mapping is designed to be used for broad planning and management tasks covering state, regional, and multi-state areas. STATSGO data is collected in 1:250,000 quadrangle units. The number of soil polygons per quadrangle map is between 100 and 400. The minimum area mapped is about 1,544 acres. Map unit delineations match at state boundaries. Composition of soil map units was coordinated across state boundaries, so that component identities and relative extents would be able to match. States have been joined as one complete seamless data base to form a national coverage. Each STATSGO map is linked to the Soil Interpretation Record (SIR) attribute data base. The attribute data base gives the proportionate extent of the component soils and their properties for each map unit. The STATSGO map units consist of 1 to 21 components each. The national coverage of STATSGO is already completed. SWAT data files for this national coverage are available with the SWAT model downloads. Soil Survey Geographic Data Base (SSURGO) Field mapping methods employing national standards are utilized to construct the soil maps in the SSURGO data. This level of mapping is designed for use by landowners, townships, and county natural resource planning and management agencies. Mapping scales generally range from 1:12,000 to 1:63,360. SSURGO is the most detailed level of soil mapping done by the NRCS. SSURGO’s digitization duplicates the original soil survey maps. SSURGO is linked to a Map Unit Interpretation Record (MUIR) attribute data base. The attribute data base gives the proportionate extent of the component soils and their properties for each map unit. The SSURGO map units consist of 1 to 3 components each. As of June 8, 2000, 831 SSURGO datasets have been archived at the SSURGO website. About 2,000 SSURGO datasets are still in process. Converting SSURGO data for use in AvSWAT There are five steps in the procedure developed to convert SSURGO data into SWAT soils input data. The process was automated with MS ACCESS . Step I. Download the Tabular and Coverage.zip Files from SSURGO Web Site Step II. Comparison of the SSURGO Tabular Data with SWAT Soils Data Format Step III. Conversion of the SSURGO Data File to a Grid File in ArcView Step IV. Building the User Soils Table using an ACCESS database with queries developed to convert SSURGO data to the AvSWAT soils data input formats. These Access queries can be used to convert any SSURGO database to SWAT formats. Step V. Running the ArcView Swat Interface The graph below shows randomly located NRI points within 30m² pixels. The spectral information received is an average of every landcover within that 30m² pixel in the Landsat image. The earthcover information from the 3-acre circle surrounding each NRI point is used to eliminate those NRI points surrounded by mixed cover types. The remaining eligible NRI points are used in a series of ERDAS classifications to classify the landuse of each pixel in the Landsat image. Access Tables and Queries used in the SSURGO to SWAT conversion. SSURGO Soils Layer within AvSWAT Landuse Layer within AvSWAT References: EPA BASINS:http://www.epa.gov/ost/BASINS/ GAP: http://www.ag.iastate.edu/centers/cfwru/iowagap/ NRI: http://www.nrcs.usda.gov/technical/NRI/ LANDSAT: http://geo.arc.nasa.gov/sge/landsat/landsat.html SSURGO: http://www.ftw.nrcs.usda.gov/ssur_data.html STATSGO: http://www.ftw.nrcs.usda.gov/stat_data.html SWAT: http://www.brc.tamus.edu/swat/ AvSWAT: http://www.brc.tamus.edu/swat/swat992.html Authors: David Buland USDA/NRCS, Natural Resources Inventory and Analysis Institute Erda Wang Blackland Research Center, Texas A&M University Bob Dayton USDA/NRCS, Natural Resources Inventory and Analysis Institute Glenn Lawson USDA/NRCS, Natural Resources Inventory and Analysis Institute Mauro DiLuzio Blackland Research Center, Texas A&M University Class Names Trees Grass Water Artificial Corn Soybeans 7/6/2000 10:01 PM