Download

1 / 11
110 likes | 284 Views
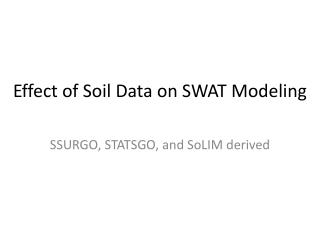
Project# 11-900. SWAT Modeling of Priority Watershed- Phase II. Dharmendra Saraswat Assoc. Prof,/Ext. Engineer- Geospatial 501-681-5987 (mobile) dsaraswat@uaex.edu Naresh Pai Post-Doctoral Associate Mike Daniels Extension Water Quality and Nutrient Management Specialist Tom Riley

E N D
Project# 11-900 SWAT Modeling of Priority Watershed- Phase II Dharmendra Saraswat Assoc. Prof,/Ext. Engineer- Geospatial 501-681-5987 (mobile) dsaraswat@uaex.edu Naresh Pai Post-Doctoral Associate Mike Daniels Extension Water Quality and Nutrient Management Specialist Tom Riley Interim Assistant Director- CED and Director, Public Policy Center 2013 NPS Conference – September 19, 2013
Objective Project Objective Prioritize 12-digit HUCs using SWAT model output 2013 NPS Conference – September 19, 2013
Background 2 1 Phase II (2011 – 2013) 3 SWAT Modeling Project 12-digit HUC Prioritization 2013 NPS Conference – September 19, 2013
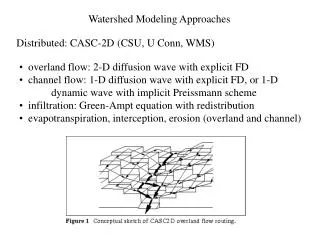
Overall Project Approach PBIAS NSE R2 RSR Precipitation Temperature Calibration/ Validation SWAT Prioritization (Flow-weighted concentration) Soils Land-use/ management practices Point Sources Topography 2013 NPS Conference – September 19, 2013
Best modeling practices (BMPs) • Sensitivity analysis • Check potential model problems using SWAT Check* • Annual calibration • Monthly calibration/validation • Qualitative comparison with AWRC data (monthly data from Oct 2011-Sept 2012 and then storm samples through March 2013) • Uncertainty analysis • Subwatershed prioritization *White et al., 2012 2013 NPS Conference – September 19, 2013
Prioritization results Poteau Critical source area analysis (CSA) suggested that merely 5% of the watershed area was responsible for 26%, and 34% of the sediment and TP overland loads, respectively. In contrast, the nitrate loading was relatively uniform in this watershed. 2013 NPS Conference – September 19, 2013
uncertainty Poteau SWAT model uncertainty band (i.e. 95PPU, shown in green) at Hackett and its comparison with the observed (shown in blue) and best simulated (shown in red) data. SWAT model uncertainty band (i.e. 95PPU, shown in green) at Cauthron and its comparison with the observed (shown in blue) and best simulated (shown in red) data. Results suggest that 55% of observed data at Cauthron and 49% of observed data at Hackett, respectively was found within 95% confidence interval of the best simulations as shown by the 95PPU plot. 2013 NPS Conference – September 19, 2013
Prioritization results Strawberry Critical source area analysis (CSA) suggested that merely 5% of the watershed area was responsible for 85%, 22%, and 16% of sediment, TP, and NO3-N loads, respectively. 2013 NPS Conference – September 19, 2013
Prioritization results Upper Saline Critical source area (CSA) analysis indicated that merely 5% of the watershed area was responsible for 28%, and 13% of the sediment and TP overland loads, respectively. In contrast, the nitrate loading was relatively uniform in this watershed. 2013 NPS Conference – September 19, 2013
Comparison with monitoring data • Overall Summary • the load comparisons were favorable across all three watersheds; • The mean concentration comparison during base flow conditions at the selected HUC 12 level showed relations in the ranks of the sites within the Poteau and Upper Saline Watersheds for NO3-N and TP, but not TSS. The monitoring data and SWAT output were not related at the Strawberry Watershed. • These results increase our confidence in the subwatershed prioritization by SWAT model for the Poteau and Upper Saline Watersheds, but not necessarily for the Strawberry Watershed. Source: Massey et al., 2013 2013 NPS Conference – September 19, 2013
Acknowledgements EPA, Region VI 2013 NPS Conference – September 19, 2013