1 / 1

E15: R=0.86, peak#=3968

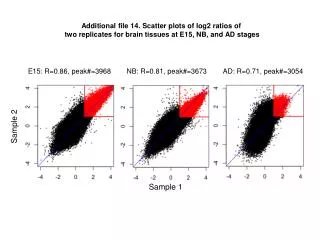
Additional file 1 4. Scatter plots of log2 ratios of two replicates for brain tissues at E15, NB, and AD stages. E15: R=0.86, peak#=3968. NB: R=0.81, peak#=3673. AD: R=0.71, peak#=3054. Sample 2. Sample 1.

Download Presentation

E15: R=0.86, peak#=3968

An Image/Link below is provided (as is) to download presentation Download Policy: Content on the Website is provided to you AS IS for your information and personal use and may not be sold / licensed / shared on other websites without getting consent from its author. Content is provided to you AS IS for your information and personal use only. Download presentation by click this link. While downloading, if for some reason you are not able to download a presentation, the publisher may have deleted the file from their server. During download, if you can't get a presentation, the file might be deleted by the publisher.

E N D

Presentation Transcript


  1. Additional file 14. Scatter plots of log2 ratios of two replicates for brain tissues at E15, NB, and AD stages E15: R=0.86, peak#=3968 NB: R=0.81, peak#=3673 AD: R=0.71, peak#=3054 Sample 2 Sample 1

More Related