Download
1 / 16
180 likes | 476 Views
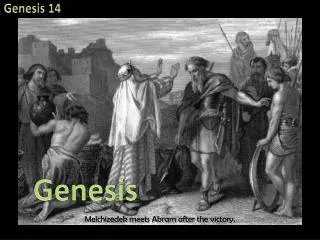
Genesis 25:24-26 24 And when her days to be delivered were fulfilled, behold, there were twins in her womb. 25 And the first came out red, all over like an hairy garment; and they called his name Esau.

E N D
Genesis 25:24-26 24 And when her days to be delivered were fulfilled, behold, there were twins in her womb. 25 And the first came out red, all over like an hairy garment; and they called his name Esau. 26 And after that came his brother out, and his hand took hold on Esau's heel; and his name was called Jacob . . .
Quantitative Genetics Timothy G. Standish, Ph. D.
How Could Noah Have Done It? • The diversity of appearance in humans and other animals is immense • How could Adam and Eve or Noah and his family have held in their genomes genes for all that we see today? • At least one explanation, that the dark-skinned races descended from Cain who was marked with dark pigment (the mark of Cain mentioned in Gen. 4:15) or Ham as a result of the curse mentioned in Gen. 9:22-27 • Quantitative or polygenic inheritance offers much more satisfying answer to this quandary
Definitions • Traits examined so far have resulted in discontinuous phenotypic traits • Tall or dwarf • Round or wrinkled • Red, pink or white • Quantitative inheritance deals with genetic control of phenotypic traits that vary on a continuous basis: • Height • Weight • Skin color • Many quantitative traits are also influenced by the environment
Nature Vs Nurture • Quantitative genes’ influence on phenotype are at the crux of the nature/nurture debate • Socialism emphasizes the environment • Fascism emphasizes genetics • Understanding quantitative genetics helps us to understand the degree to which genetics and the environment impact phenotype • Aside from political considerations, quantitative genetics helps us to understand the potential for selection to impact productivity in crops and livestock
CR CW CR CW F2 Generation CRCR CRCW 1: 2: 1 CRCW CWCW CRCR CRCW CWCW Additive Alleles • Additive alleles are alleles that change the phenotype in an additive way • Example - The more copies of tall alleles a person has, the greater their potential for growing tall • Additive alleles behave something like alleles that result in incomplete dominance • More CR alleles results in redder flowers
1/16 1/4 BB -- 1/16 AABB 1/2 Bb -- 2/16 AABb 1/4 bb -- 1/16 AAbb 1/4 BB -- 2/16 AaBB 1/2 Bb -- 4/16 AaBb 1/4 bb -- 2/16 Aabb 1/4 BB -- 1/16 aaBB 1/2 Bb -- 2/16 aaBb 1/4 bb -- 1/16 aabb 4/16 = 1/4 6/16 = 3/8 4/16 = 1/4 1/16 Additive Alleles • If more than one gene with two alleles that behave as incompletely dominant alleles are involved, variability occurs over more of a continuum • If two genes with two alleles are involved, X phenotypes can result Additive alleles 4 3 2 3 2 1 2 1 0 F2 1/4 AA 1/2 Aa 1/4 aa
Additive Alleles • Graphed as a frequency diagram, these results look like this:
1 = F2 extreme phenotypes in total offspring 4n 1 1 = 64 43 • The more genes involved in producing a trait, the more gradations will be observed in that trait • If two examples of extremes of variation for a trait are crossed and the F2 progeny are examined, the proportion exhibiting the extreme variations can be used to calculate the number of genes involved: Estimating Gene Numbers • If 1/64th of the offspring of an F2 cross of the kind described above are the same as the parents, then N = 3 so there are probably about 3 genes involved
Economic Implications Environment or genetics?
Sum of individual values SXi = X X D Frequency n Number of individual values D Trait Describing Quantitative Traits:The Mean • Two statistics are commonly used to describe variation of a quantitative trait in a population • The Mean - For a trait that forms a bell-shaped curve (normal distribution) when a frequency diagram is plotted, the mean is the most common size, shape, or whatever is being measured
-1 +1 Number of individuals in each unit measured Total number of individuals in sample nSf(x2) - (Sfx2) X D Frequency = n(n - 1) Gradations of units of measurement 68.3% D Trait Describing Quantitative Traits:Standard Deviation • Standard Deviation - Describes the amount of variation from the mean in units of the trait • Large SD indicates great variability • 68 % of individuals exhibiting the trait will fall within ±1 SD of the mean, 95.5 % ±2, 99.7 % ±3 SD • 95 % fall within 1.96 SD s
Heritability • Heritability is a measure of how much quantitative genes influence phenotype • Two types of heritability can be calculated: • Broad-Sense Heritability: • H2 - Expresses the proportion of phenotypic variance seen in a sample that is the result of genetic as opposed to environmental influences • Narrow-Sense Heritability: • h2 - Assesses the potential of selection to change a specific continuously varying phenotypic trait in a randomly breeding population
Genetic and Environmental interactions Environment Genetics VG = VP • Proportion of phenotypic variance resulting from genetic rather than environmental influences • Components contributing to phenotypic variation (VP) can be summarized as follows: 1 Broad-Sense Heritability • As long as this is the case, broad heritability can be expressed as the ratio of environmental to genetic components in phenotypic variation VP = VE + VG + VGE • VGE is typically negligible so this formula can be simplified to: VP = VE + VG H2
Interactive or epistatic variance Additive Dominance VA = VP • Potential of selection to change a specific continuously varying phenotypic trait • Narrow-sense heritability concentrates on VG which can be subdivided as follows: 2 Narrow-Sense Heritability • As long as this is the case, narrow-sense heritability can be expressed as the ratio as follows: VG = VA + VD + VI • VA is typically negligible so this formula can be simplified to: VP = VE + VG h2
The End