Download

1 / 21
210 likes | 234 Views
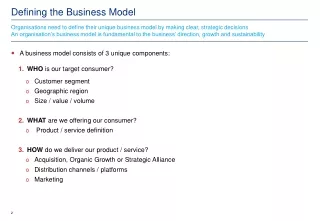
Understanding the Business Model of the FHSAA. Linda D. Robertson Associate Executive Director for Business February 2015. FHSAA History. 1920 - Opened as a Private Corporation – operating out of UF’s Peabody Hall Organized and formed by coaches seeking fair play. The Business of FHSAA.

E N D
Understanding the Business Model of the FHSAA Linda D. Robertson Associate Executive Director for Business February 2015
FHSAA History • 1920 - Opened as a Private Corporation – operating out of UF’s Peabody Hall • Organized and formed by coaches seeking fair play
The Business of FHSAA • 1952 – Designated a Non-Profit Private Corporation • Governed by its Public & Private Schools • 2014 – 798 Member schools (227 Private; 571 Public)
History of Legislation regarding FHSAA • 1997 – First recognition in Florida Statutes • Named the governing organization for HS athletics for PUBLIC schools (no option) • 2003– Legislative study recommended raising fines for eligibility violations and added physical exam requirements • 2012 – HB 1403 changed eligibility rules on transfers and recruiting
The Business of FHSAA – Myths & Truth Myth #1 Perceived as relying on Public Funds (taxes) Truth • FHSAA does NOT receive state funding or tax dollars • The Florida Education Finance Program(FEFP)doesNOT provide funding for Athletics or Extra Curricular Activities • Public Schools rely heavily on Activity Funds from ticket sales, fund raisers and donations to fund Athletics • FHSAA Policy requires member schools only use non-public funds to pay FHSAA dues, fees and fines
The Business of FHSAA – Myths & Truth Myth #2: Perceived as relying on Penalties/Fines for funding Truth • Less than 3% of resources are Fines (2013-14 FY) ($112,739 Public, $23,460 Private Schools, $14,530 Officials)
2013-14 $150,000 in Fines 469 school fines for $135,500 = Average $289 per fine
History of Fines • FY 2008 $521,475 • FY 2014 $150,229
Financial Goal(adopted 2009) “Fund the organization with 100% ticket sales from State Finals, Sponsorships, Media contracts, and Royalties so there is No Financial Burden to our Schools”
6 Yr Record In 2014-15 - FHSAA will redirect $1.2 million more PER YEAR to schools compared to 2008 $400,000 - Membership Dues Reduced to nominal $25 $168,000 – More being paid to Finals Teams ($417,000/year) $371,000 – Less in Fines $116,000 – Less in FB Classic Fees & elimination of Recognized Sport Participation fees $65,000 – Less in Tournament Sanction Fees $43,000 - FHSAA Share of State Series Reduced – now only collect 15% on 7 sports and 25% football
Let’s Talk About…What’s Better for Student-Athletes FHSAA changes since 2008 • 33% More participation in Championships • 6 to 8 classifications in team sports • 2 to 3 classifications in Golf (50% increase) • 3 to 4 classifications in Swimming & Diving • Competitive Cheer began Regional Competitions • Inclusion of Adaptive Track and Unified Sports Basketball • New Rural Division in Team Sports (except soccer) • New FASMED Committee focusing on Student Welfare and Safety • Changes in Policy & By-Laws that are Student Focused
Transparency to the Public Website: • Budgets – Detailed and Summarized (sample charts next slide) • Audits • IRS form 990 • Presentations – Myths & Truths • State Championship Attendance, Financials, Other Statistics Public Board Meetings: • Discuss/Approve Budgets, and set Fee Policies • Present independent audits annually (& provide to State Auditor General) • IRS form 990 provided for information • Board minutes archived on website Florida High School Athletic Association
Where Money Comes From$5,297,426 2013-14 FY
Where Money Goes - $5,032,501 2013-14 FY
School Athletic Funding Regular season is 100% school resource (nothing to FHSAA unless special event) Post season: $8+ Million (tickets, concessions, parking and team pay for championships) stays at school 3,678+ State Series Events are Hosted by Schools Schools Share of Gate Receipts for District & Region: 100% for 24 sports 85% for 7 sports 75% for football
School Athletic Funding Changes in last 6 Years on % of Gate to FHSAA: 2008/09 – 16 Sports paid $60,000/yr in participation fees (instead of % of gate) 16 Sports paid 15%-25% of gate to FHSAA Today: 7 team sports pay 15% of gate football pays 25% of gate ALL other revenue shares to FHSAA have been eliminated
FHSAA State Championships: 246 Finals Events Hosted by FHSAA each Year Single largest funding source for the FHSAA $1 Million per year gross revenue Funds used to pay $690,000 expense: Participating teams paid $417,000 Officials Trophies Other event costs Net to fund FHSAA $310,000
Financial Reform FHSAA is an organization in the middle of major financial reform – a few examples: 2008/09: $300 - $1,100 member fee based on size $500,000 collected in fines 32 sports paid either share of gate or participation fee for State Series $249,000 paid to teams participating in State Finals Today: $25 Membership fee $138,000 collected in fines 8 team sports share a percent of gate for State Series $417,000 paid to teams participating in State Finals
The Business of the FHSAA You can Define the Purpose of a Business by where it gets its money and how it spends its money • 89% of expense is Event Management, Officials, Training & Publications, and General Administration • 11% of expense is Compliance and Eligibility • FHSAA does not receive State funding or tax dollars • FHSAA is a Non-Profit Private Corporation • FHSAA’s post season State Series generates $8+ million per year for member schools athletics
501c(3) Annual Resources Then and Now State Series Events Florida High School Athletic Association
Funding a Non-Profit Athletic Organization Member Fees Service Fees Donations (rare) Sponsorships/Advertising/Media Rights Event Fees & Ticket Sales Merchandizing (Logo mechandise, photography, souvenirs) Interest on Investments Choices are being made to develop a model that best serves the purpose of the organization at the least cost to those it serves (member schools)