Download
1 / 41
480 likes | 1k Views
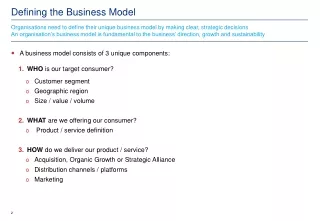
The Bidvest Business Model. An operationally active investment holding company whose core competence is the. management of a balance of cash generative and growth businesses. Market-leading service, trading & distribution businesses. Implementation. Strategy.

E N D
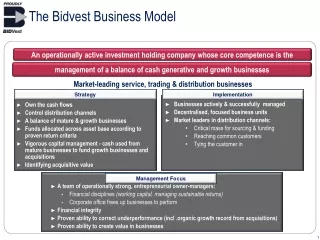
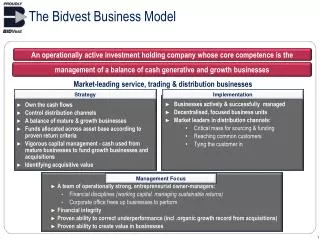
The Bidvest Business Model An operationally active investment holding company whose core competence is the management of a balance of cash generative and growth businesses Market-leading service, trading & distribution businesses Implementation Strategy • Businesses actively & successfully managed • Decentralised, focused business units • Market leaders in distribution channels: • Critical mass for sourcing & funding • Reaching common customers • Tying the customer in • Own the cash flows • Control distribution channels • A balance of mature & growth businesses • Funds allocated across asset base according to proven return criteria • Vigorous capital management - cash used from mature businesses to fund growth businesses and acquisitions • Identifying acquisitive value • A team of operationally strong, entrepreneurial owner-managers: • Financial disciplines(working capital, managing sustainable returns) • Corporate office frees up businesses to perform • Financial integrity • Proven ability to correct underperformance (incl .organic growth record from acquisitions) • Proven ability to create value in businesses Management Focus
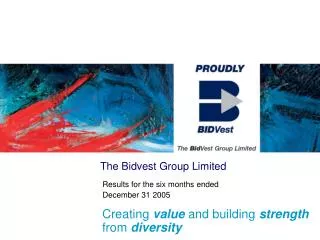
Unaudited Results For six months ended December 31 2008
Agenda • Introduction • Financial Results • Group Outlook • Appendices: • Appendix 1: Geographic and Segmental Revenue and Trading Profit • Appendix 2: Divisional Results • Appendix 3: Historic Performance
Introduction Brian Joffe
H1 F2009 results summary Introduction Revenue 11% to R60,0bn Trading profit 6% to R2,6bn Headline earnings 10% to R1,4bn EPS 9% to 530,4cps HEPS 9% to 454,0cps Normalised HEPS* 1% to 494,0cps DPS 14% to 190cps Cash generated from operations 41% to R0,9bn ROFE from 37.6% in H1 F2008 to 32.4% in H1 F2009 * HEPS, excluding non trading costs of R165m (40cps after tax) related to closure and re-organisation of operations Note: IFRS compliant
CEO’s opening conclusion Introduction • The world has changed, and changed forever; we are living in the new normal • Good people matter more than ever - Bidvest has them • Are we fearful of the economic upheaval? Not a bit • Do we see opportunity? You bet – the Group will continue to adapt • What are our people inspired to do? • Use their gumption • Be resourceful • Strengthen partnerships • Get back to brass tacks • Be good housekeepers - we haven’t got limitless cash • Be alert to the potential a world of uncertainty and difficulty offers • Bidvest gains strength from its diversity and shall succeed – wherever in the world the Group trades
Financial Results David Cleasby
H1 F2009 – FD’s perspectives Financials • Risk aversion prevalent • Creditworthiness under scrutiny by lenders • Favourable funding terms less easy to come by • Overall costs not declining; increased credit spreads with decreasing base rates • Bidvest has a fiduciary responsibility to stakeholders to husband its resources appropriately for the times • Optimal funding structures will continue to be investigated • Cash will be conserved • Working capital will be managed as effectively as we are able • Internal controls stepped up as increased fraud & criminal activity prevalent
Consolidated Income Statement Financials • 11% organic growth • 8% growth excluding exchange rate translation • 17% growth excl. McCarthy in both periods
Consolidated Income Statement Financials Note: 1. All growth in Trading Profit is organic 2. Foreign businesses = 30% contribution to Trading Profit vs 27% in H1 2008
Consolidated Income Statement Financials • Increase in finance expense due to increased funding rates, increased utilisation • Foreign interest of R76,5m vs local interest of R486,4m • Net debt offshore of R1,4bn vs local net debt of R6,5bn • Finance cost has peaked • 2nd half: • More internal working capital management & capex scale-back • H2 much better from a working capital perspective • Falling interest rate environment
Consolidated Income Statement Financials Associates: Tiger Auto (Sold for R212m with effect from Feb 2008) Enviroserv(Sold for R569m with effect from Nov 2008) Comair Other Note: Includes dividends received
Consolidated Income Statement Financials
Consolidated Income Statement Financials
Consolidated Income Statement Financials • Decisive remedial actions deliberately taken to put the Group in a stronger position at a time of uncertainty and worldwide economic recession: • 3663 Barton Meat: perennial loss maker closed + other closures - £10,1m charge • Bid Auto: rationalisation of dealerships – R27m charge
Consolidated Income Statement Financials HEPS, excluding non trading costs of R165m (40cps after tax) related to closure and re-organisation of operations, would have been 1% down
Consolidated Income Statement Financials 302,9m vs 310,2m diluted weighted avg shares in issue
Consolidated Income Statement Financials Dividend cover of 2,4x
Consolidated Cash Flow Statement – Rm’s Financials Half-year ended Dec 31 2007 Half-year ended Dec 31 2008 Cash generated from ops Working capital utilised Net Finance charges Taxation Distributions Cash effects of investment act’s Cash effects of financing act’s • Investment activities: • No material acquisitions • Capex of R1,2bn is similar to H1 2008 • In the 4½ years to Dec 2008: • R9,8bn cash generated from operations after working capital, tax and distributions, supported the R12,5bnspent on acquisitions & investments of businesses for medium term growth • Full benefits still to manifest
Net Working Capital Days Financials Half-year ended Dec 31 2008 9 5 17 9 16 Net days Debtors days Stock days Creditors days • Some improvement in working capital management: • Inventory - increased strategic buying & longer supply chain • Debtors - quality of debtors book is sound, but increasing debtor delinquencies • Creditors - impact of importing stock with shorter credit lines
Net working capital flows vs cash generated Financials Half-year ended Dec 31 2008 • Upward trend in half on half cash generated • Working capital utilisation typically better in 2nd half
Gearing Financials Half-year ended Dec 31 2008 Target interest cover range • Clean EBITDA interest cover of 6.1x; Interest cover of 4.7x vs target of 5-6x • Full year interest cover should be back within target range
Group Outlook Brian Joffe
CEO’s closing conclusion Group Outlook • Business cycles are an age-old hardy perennial – this is a necessary corrective phase • Bidvest remains entrepreneurial • Management are really energised • We know our businesses but we don’t pretend to know the future • We manage for all eventualities, although the following unknowns could have a big effect: • Interest rates • Exchange rates • Deflation will become an issue • Operating conditions are still challenging • Difficult times provide opportunity and Bidvest is alert to the potential this offers Bidvest will, at best, maintain HEPS in F2009
Joffe’s take on the businesses Group Outlook
Joffe’s take on the businesses Group Outlook 26
Joffe’s take on the businesses Group Outlook
Joffe’s take on the businesses Group Outlook 28
Joffe’s take on the businesses Group Outlook
Joffe’s take on the businesses Group Outlook 30
Joffe’s take on the businesses Group Outlook
Joffe’s take on the businesses Group Outlook 32
Joffe’s take on the businesses Group Outlook
Joffe’s take on the businesses Group Outlook 34
Joffe’s take on the businesses Group Outlook
Joffe’s take on the businesses Group Outlook 36
Joffe’s take on the businesses Group Outlook
Joffe’s take on the businesses Group Outlook 38
Joffe’s take on the businesses Group Outlook
Joffe’s take on the businesses Group Outlook 40