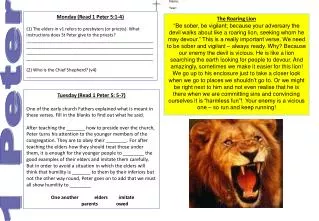
Peter
Looney Tunes Asset Management. Juan. Russell. Kenny. Peter. Assignment Objective. Apply cross-sectional stock selection model to South African stock exchange (100 securities) Identify intricacies of building and running such a model. Model Design. Coded using Excel VBA


Peter
E N D
Presentation Transcript
Looney Tunes Asset Management Juan Russell Kenny Peter
Assignment Objective • Apply cross-sectional stock selection model to South African stock exchange (100 securities) • Identify intricacies of building and running such a model
Model Design • Coded using Excel VBA • Data and model results stored in MS Access • Excel Solver and correlation tools used • Scalable to any number of securities and regression attributes
Model Flow • Run time series regressions for 100 firms • Store attribute and firm specific coefficients • Retrieve attributes and firm specific coeffs. on a given date for 100 firms • Run cross sectional regression and store intercept and coeffs.
Model Flow • Use coeffs. to forecast next period return • Generate covariance-variance matrix • Optimize portfolio using predicted returns and volatility and store portfolio weights • Automatically repeat process for in-sample test
Problems • Base data incomplete. Extensive rule base included in model to deal with data problems • Low explanatory power of attributes (low t-values) on some securities • Limited data affects regressions • Long processing times
Results • Used book-to-market • Two year in-sample test • Low average R2 = 2%
Proposed Future Improvements • Use of GARCH modeling to forecast volatility • Extend infrastructure to run sorting/screening models • Complete and augment base data with more attributes