Download
1 / 41
410 likes | 569 Views
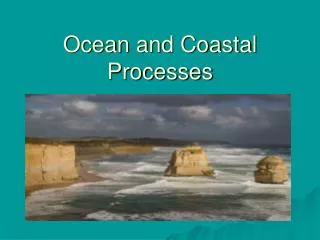
Ocean Circulation and Marine Life relationships between the mean biological, nutrient and physical patterns part 1.

E N D
Ocean Circulation and Marine Liferelationships between the mean biological, nutrient and physical patternspart 1
Our purpose is an examination of oceanic observations for evidence that yields relationships and provides understandings of how the fundamental biological, chemical and physical patterns are maintained. To do so, restrictions are imposed on the data and its analytical treatment that limit the interpretation of the resulting patterns. Averaging procedures smooth away spatial variations less than 100 kilometers in size because that is a useful characterization of the current instabilities and resulting eddies that reduce property anomalies by time-dependent turbulent mixing. So the patterns that we use will not exhibit changes over distances that are less than 100 km and, as well, the patterns are assumed never to change in time. Query : is this a useful way to proceed ? Answer: yes. Remember, our current models are based on the concept of balanced forces meaning they can change from place-to-place but at any place they do not change in time. All the other data, chemical and biological, must herein be the same.
do atmospheric and oceanic physical processes determine an ocean’s biological distributions ? Joe Reid published a study of the relationships between ocean circulation and marine life in 1978. This work was the initial, fundamental examination of ocean-wide biological provinces and physical processes that led to definitive evidence of a significant correlation between steady-state flow and steady-state biological patterns. The horizontal and vertical motion is explained with the physical theories that account for the affect of gravity and wind. The overall pattern of circulation expresses the dominance of geostrophic balance and convergence-divergence within anticlockwise and clockwise gyrals. As well, the differences in the climatic and related vertical circulations contribute significantly in the over-all production of the different habitats for life forms. As a preview, the subarctic and subantarctic clockwise gyres that have equator-ward extensions along eastern ocean boundaries are cold, high in nutrients, and have low numbers of species in which each has a relatively large biomass. The subtropical clockwise gyres are warm, low in nutrients, and have relatively high numbers of species for which each has a relatively low biomass. As we work the physical and biological patterns your task is to develop an understanding of how these steady, mean relationships are maintained.
the Geostrophic model applied to a northern hemisphere subtropical gyre
Oceanographers have observed and studied data bearing on biological, chemical and physical relationships for more than a century. For our immediate studies alone, we have pointed out some of those concerned and given credit for very early success. Collections and classification led to the studies of marine organisms in terms of their relationships to the environment. In the mid-1830’s, Muller’s net tows and examin-ations with microscopes led to the identification of the planktonic basis of the food web and fundamental reasons for the variations in oceanic nutrient patterns. The American biologists Agassiz and Bigelow contributed to changes that emphasized correlation of organisms with one another and with the environment. In chemistry, Buchanan’s pioneer observations on the Challenger led to Dittmar’s work that identified the major dissolved ionic constituents, Forchhammer and Marcet’s constancy principles and Knudsen’s definition and determination of salinity. The determination of the composition of plankton organisms by Vinogradov in the 1930’s and observations at sea of the important nutrients phosphate, silicate and compounds of nitrates all but erased distinct lines separating chemistry and biology. For physics, Coriolis solved the importance of the earth’s rotation. Scandanavians Helland-Hansen and Bjerknes’ theoretical work on currents in variable density ocean waters (geostrophy) that was made possible by Nansen’s advances in temperature and salinity accuracies and Ekman’s theory of wind-driven currents. Their works contain the concepts and results for OCNG 251’s steady-state, force-balanced explanation of oceanic flow.
Boyle Buchanan Dittmar Forchhamer Marcet’s wife, Jane
Food webs are illustrations that portray energy transfer pathways between populations. Food pyra-mids do the same. In the pelagic open ocean, waters can be nutrient-limited with low produc-tivity and populated by extremely small organisms in large, complex food webs. In upwelling regions, waters can be high in nutrients and production. As a rule, the more productive an environment, the fewer levels in the web and the larger the organisms that populate it. The term plankton includes all of the marine organisms that do not stem currents. There are phyto- plankton, plant plankton, animal plankton known as zooplankton, and bacterioplankton that provide a decomposition stage for returning organic to nutrient material. Phytoplankton require an external source of energy for the synthetic fixation of carbon. In this regard, solar radiation light values and variability play a strong role in food’s primary production. Photosynthesis fixes most energy utilized in the ocean. The process is carried out by auto-trophic organisms that use water as a hydrogen donor and liberate oxygen. At a higher food pyramid level heterotrophs consume the plants and, in turn, can serve as food themselves. The reverse of photosynthesis is known as respiration, the combination of fixed carbon and oxygen during which water and carbon dioxide are produced.
CORIOLIS EKMAN NANSEN BJERKNES HELLAND-HANSEN
MULLER BIGELOW AGASSIZ VINOGRADOV
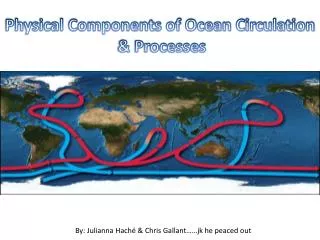
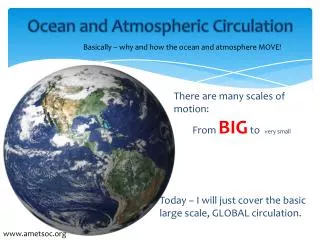
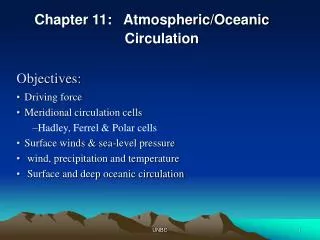
The chart of the world ocean average surface currents is closely correlated with mean atmospheric pressure patterns. This is particularly evident in the case of the North Pacific Gyre when it is juxtaposed with the overlying NE Trade and Westerly winds. This system applies a clock-wise torque at the ocean surface driving the gyre and producing transport toward its center. The converse holds for the Alaska and Oyashio Currents.
The convergence of waters toward the center of the subtropical gyres is shown by the blue Ekman transport vectors. Recall that the depth over which the transport occurs depends on the magnitude of the wind speed. The result of this convergence is a mound of water most often simply shown as disk with a raised central portion in order to facilitate an understanding of a continuous circula-tion path around its periphery. Re-member that the mound is skewed toward the western boundary because of the land’s rotation eastward into the ocean’s waters. The resulting subtropical gyral can be studied in terms of a geostrophic current theory that balances center-to-edge pressure gradient forces derived from the temperature salinity observa-tions with the theoretical Coriolis force calculated at the appropriate latitude.
distribution of the global marine surface winds correlated with the pattern of mean ocean surface currents
General Light, Nutrient and Productivity Distributions The availability of light that can sustain the photosynthetic process [white triangle] is affected by the angle of incidence of solar radia- tion with respect to the ocean surface. Latitude represents this relationship. Nutrient concentration [blue area] is related to the upwelling process and the amount of detrital material descending into the mesopelagic zones of the adjacent biological provinces. Productivity [black lines] shows a continuous process in the tropics; two peaks, related to spring and fall winds, associated with temperate climates; and a single growth inter-val during high latitude summers.
A relative view of productivity values for tropical, temperate and polar regions . The generation of biomass is to be taken as a measure of productivity.
mid-latitude relationships between season, environment, and plankton
SEASONAL JOINT PROGRESSION OF MAJOR OCEANIC ENVIRONMENTS AND ASSOICATED RELATIVE PHYTO- AND ZOOPLANKTON ABUNDANCES
Control of Primary Production Primary production is quite low in much of the world’s ocean and extremely high in a few regions where a positive climatic influence becomes paramount. In general, there are four controlling factors: light, horizontal and vertical mixing, nutrient availability and herbivore grazing. The balances that are struck between these influences determine the patterns evident in planktonic geographical distributions. Photosynthetic chemistry requires energy from solar radiation. The light intensity arriving at the sea surface varies with latitude, season, and time of day. Throughout the epipelagic water column, both the quantity and quality of the light depends on the concentration of suspended material and dissolved organic matter. With penetration, the light is selectively absorbed as a function of wavelength by water molecules, suspended particles and dissolved organic material. Light penetration is deepest in the clear water near the center of subtropical gyres : nearly 90% is absorbed by a depth of 70 meters with the greatest absorption being in the first few meters at the infrared and red end of the solar radiation spectrum. The photosynthetic process is effectively out of business by a depth of 150 meters. Blue-green and blue portions are the shortest wavelengths of the solar spectrum and penetrate deepest. However, by 1000 meters, the deep of the mesopelagic zone, there is virtually no light left to be absorbed. A variety of light-absorbing pigments allows different phytoplankters to carry out carbon production at different wavelengths. Overall, light of wavelengths from 400 to 720 nanometers (nm) provide the energy for plant production. Each pigment is tuned to a narrow wavelength band and this is responsible for a plant’s characteristic color. Cholorophyll a is an important pigment whose absorption band peaks 670 to 695 nm.
primary production zooplankton biomass
This schematic of a northern hemi-sphere ocean, implicitly bounded to the north, east and west by land, represents and simplifies the North Pacific Ocean. The two gyres, Sub-tropical and Subpolar, are wind-driven surface currents in response to the spin [torque] applied by the wind systems. These winds also force transports with depth, movements we describe with Ekman theory. that are part of vertical convection cells. The subtropical gyre and its clockwise flow imply that the winds also produce inward transport we call convergence. Downwelling occurs within the gyre due to increased density brought about by evaporation at the surface . In the subpolar gyre, the counter-clockwise motion of the surface waters and the winds are a tell-tale for divergence, that is,upwelling in the central portion of the gyre and outward flow. These aspects of flow and their connections can be thought of as a cell whose flow pattern impacts nutrient and biological distributions.
WATERS SINKING ALONG ISOPYCNAL [CONSTANT DENSITY] SURFACES When extreme climatic conditions create a localized pool of surface waters, a new water mass denser than adjacent water masses, downwelling will occur because of gravity. The OCNG 251 concept that represents the sinking process is called “sinking along isopycnal surfaces” during which the new water mass moves with a vertical component of flow along constant density surfaces until its density matches the density of deeper, adjacent waters. Then this new water mass begins to move horizontally, partially driven by sinking of additional new waters back in the source region. The case shown above is a schematic of the generation of Antarctic Intermediate Waters along a continuous front around Antarctica that is the juncture at the surface of the northern edge of the cold, fresh Antarctic Circumpolar Current and the warm, salty Central Waters of subtropical gyres. The [T,S] vertical distribution at “A” reflects the horizontal surface distribution in the source region [A to B]. Now apply such a sinking concept to waters created by evaporation occuring at the surface within the North Pacific subtropical gyre centered about 30 degrees north latitude. Spreading out in all directions from the center of the gyre, we can consider that there is horizontal motion towards the gyre periphery within the mesopelagic zone. As this occurs, the waters pick up nutrients developed from the rain of detrital material coming from above. The waters are “recharged” with nutrients at depth in this manner and exported from the subtropical gyre.
Secchi Disk Observations These observations assess water clarity in terms of the depth at which the observer decides the disc can no longer be seen. Just east of the international date line, at about ten degrees north latitude, the water is so clear that the depth is greater than sixty meters. There is very little in the way of suspended material in the water column at this location. Remember that water transparency should be highest in regions wherein there are low concentrations of plants and should be reduced when plants are abundant. Abundancy is quite dependent on the availability of nutrients and light sufficient to support photosyn-thesis. The shallowest readings are along the periphery of the subtropical gyre, in fact, within the subarctic gyre from the Kamchatka Peninsula and Kuril Islands across to North America as well as the eastern boundary (California) current and the eastern tropical Pacific.
end of part 1 and begin part 2
The biogeography of zooplankton populations in the Pacific, the zoogeography,, was examined by Brinton in the mid-1900s when the data base of the crustaceans of the Order Euphausiacea, a widespread pelagic animal group, was deemed sufficient to support interpretation. It was not the first such work as, for instance, Beiri (1959) who preceded with a study of another group, the Chaetognatha. What is important was the recognition by both oceanographers that there was a close relationship between specific species geographic limitations and unique water mass boundaries. Thus, the presence of species in a tow sample is sufficient to identify the locale in which it was taken. We knowregions have distinctive fauna and it is possible to delineate biological provinces that contain them.
This is the world-wide distribution of the euphausiid group Stylocheiron Maximum described by Brinton in 1975. The vertical zonation discovered for these vertically migrating zooplankters ranges from the surface to 700 meters over the epipelagic and mesopelagic. In general, any group’s horizontal distribution is dependent on a circula-tion system, either an oceanic gyre or current-countercurrents. These physical features maintain both water masses and their characteristics. For most euphausiid species, there is a conspicuous correlation between their presence and surface temperature. However, the case above shows that this particular group is exceptional, spanning much of tropical and temperate climates while defining their absence in the polar, very cold, and in regions of extreme oceanic warmth, as in the Arabian Sea.
Using pelagic animals as indicators of water masses and motion is a concept as old (or older) as the Challenger Expedition era. We can use the converse to seek reasons for the distribution of certain plankton relative to others and isolation of species from one another. It has been confirmed that there is good agreement between many pelagic species limits and water mass boundaries. Bob Bieri [1959] found this to be most pronounced in the Eastern Pacific where “currents are relatively sluggish, allow more distinct and permanent temperature and salinity dis-continuities, and do not displace the populations very far before they are elim-inated by adverse environmental factors”. As well, observations indicate that the abundance of species within their distri-bution is dependent on the availability of food as well as a water mass’ temperature and salinity.
Subtropical gyres are the most widespread of biological provinces. They have more common species than other provinces. Euphausia brevis is a globally distributed species with five subpopulations and, in the Atlantic and Pacific Oceans, they are clearly separated by the current and water mass char-acteristics of the equatorial zone. In the western North Pacific, this species exhibits distribution extensions to the north and south brought about by the development of boundary currents.
One may not expect exactly the same species across the equator. Euphausia hemigibba is found in four of the subtropical gyres, however a fifth gyre, the South Pacific, has a sibling species, E. gibba. Be aware that there are other subtropical species that are not as tightly bound to separate gyres and “transgress” the equatorial barrier.
What is the name of the current associated with the red shading ? This is a representation of the upper layer horizontal circulation of the Pacific Ocean drawn from ocean observations all made within a decade. Flow between adjacent lines is relatively stronger when the lines are closer together; the shaded regions color between two adjacent lines. The blue shade shows the counterclockwise flow around the subpolar gyre; the yellow presents an incomplete clockwise flow path around the subtropical gyre, left incomplete because the western portion of the observations were too many years later to demonstrate continuity in the pattern. The light green shade is a northern portion of the clockwise Antarctic Circumpolar Current that shows a northward extension along the western side of South America [Do you remember this current’s name ?] . The dark green shade is a faster, more organized portion of the ACC.
Both the California Current in the North Pacific and the Peru Current in the South Pacific produce extensions of the range of certain zooplankton along eastern sides of the subtropical gyres (blue shading). E. Pacifica spans the North Pacific Current while E. Mucronata calls the Peru Current home. When these populations are farthest from polar regimes they are not always in the best of health.
Species of subequatorial distributions can sometimes be found at higher latitudes by means of western boundary currents. In the above case E. diomediae has been found in abundance south of japan along the Kuroshio and reaching eastward within the Kuroshio Extension.
References The Distribution of the Planktonic Chaetognatha in the Pacific and their Relationship to the Water Masses.Robert Bieri. Limnology and Oceanography Vol. VI, No. 1, pp. 1-28. January, 1959. The Distribution of Pacific Euphansiids.Edward Brinton.Bulletin of the Scripps Institution of Oceanography of the University of California, La Jolla, California. Volume 8, No. 2, pp. 51-270. University of California Press, Berkeley and Los Angeles, 1962. Ocean Circulation and Marine Life.Joseph L. Reid, Edward Brinton, Abraham Fleminger, Elizabeth Venrick, and John A. McGowan. Advances in Oceanography, pp. 65-130. Plenum Publishing Company. 1978.