
Uploaded by
sarah
4 SLIDES
159 VIEWS
40LIKES
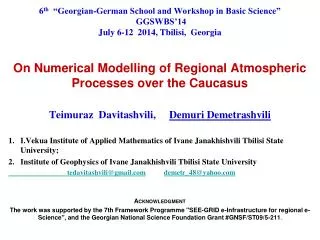
Weather Atmospheric Processes Analysis - Moisture Transport and FGEN Visualization
DESCRIPTION
Analyzing moisture transport vectors and FGEN patterns at surface to 1.5 km AGL for weather forecasting.
Download
1 / 4
Download Presentation 
Weather Atmospheric Processes Analysis - Moisture Transport and FGEN Visualization
An Image/Link below is provided (as is) to download presentation
Download Policy: Content on the Website is provided to you AS IS for your information and personal use and may not be sold / licensed / shared on other websites without getting consent from its author.
Content is provided to you AS IS for your information and personal use only.
Download presentation by click this link.
While downloading, if for some reason you are not able to download a presentation, the publisher may have deleted the file from their server.
During download, if you can't get a presentation, the file might be deleted by the publisher.
E N D
Presentation Transcript
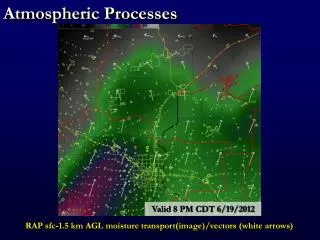
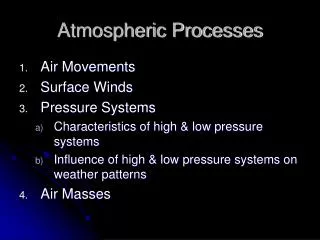
Atmospheric Processes Valid 8 PM CDT 6/19/2012 RAP sfc-1.5 km AGL moisture transport(image)/vectors (white arrows)
Atmospheric Processes Valid 8 PM CDT 6/19/2012 RAP sfc-1.5 km AGL FGEN (image)/moisture trans vectors (white arrows)
Atmospheric Processes Valid 4 AM CDT 6/20/2012 RAP sfc-1.5 km AGL moisture transport(image)/vectors (white arrows)
Atmospheric Processes Valid 4 AM CDT 6/20/2012 RAP sfc-1.5 km AGL FGEN (image)/moisture trans vectors (white arrows)


More Related