Download
1 / 12
120 likes | 140 Views
Learn about the development and implementation of joint performance measures at the Annual Data User Conference by Fred Klunk, Director of Statistical Reporting. Understand the key factors, metrics, and reporting frequency to drive policy decisions effectively. Gain insights into the digital dashboard locations and the importance of trend analysis for resource allocation and internal changes. Discover the significance of utilizing technology for impactful decision-making.

E N D
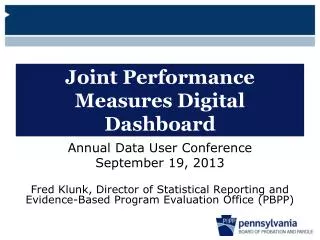
Joint Performance Measures Digital Dashboard Annual Data User Conference September 19, 2013 Fred Klunk, Director of Statistical Reporting and Evidence-Based Program Evaluation Office (PBPP)
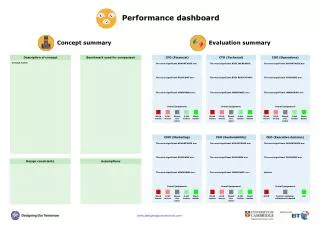
Presentation Outline 1 • Earlier PBPP work on joint measures • Joint Data Management • Joint Performance Measures with DOC • Formation of digital dashboard • Choice of metrics shown • Determination of reporting frequency • Demonstration of PBPP dashboards • Monitoring of trends • Policy decisions on outcomes
Joint Performance Measures 2 • Work in 2005 displayed measures important to PBPP and DOC. Example:
Joint Performance Measures 3 Two statements on initial goals from August 2005 presentation: • Develop a report for upper-level management that tracks the flow of offenders through the system and tells us how well the process is operating from a macro level • Use the data to identify problems and to make appropriate policy or procedure recommendations
Joint Performance Measures 4 • View of joint measures since 2007
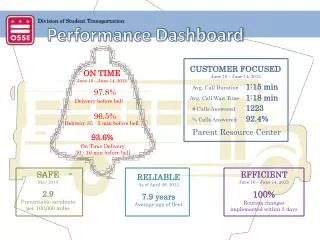
Joint Performance Measures 5 • The what and the why of dashboards • Dashboards are a quick way of presenting topics pictorially and getting the point across to the audience • The platform used, iDashboard, is pretty flexible and relatively easy to work with • Dashboards are a way to show change over time, deviation from a standard, and indicate areas to focus on • In response to the Justice Reinvestment Initiative (JRI)
Joint Performance Measures 6 • Key factors when choosing measures • What is measurable? • What is meaningful? • Know the audience • Know the business process • What drives decisions? • Confidence in data quality
Joint Performance Measures 7 • Frequency of reporting • Time interval and length of time shown • What is the best way to tell the story… without too much • Consider burden on system and resources
Joint Performance Measures 9 Digital Dashboard Locations PBPP digital dashboard http://isra.hbg.psu.edu/pajsjpm/Home/tabid/2018/Default.aspx CJAB dashboard http://PaCJABDash.net
Joint Performance Measures 10 • Trend analysis • Use the data to show what’s working and what’s not working • Where can scarce resources be targeted? • Policy determination • Use outcomes for internal changes • Provide decision-makers with tangible information
Final Points 11 Summary • Know your audience, know your processes, know your data • Dashboards can be quite effective… or not • Use technology to your advantage Questions??