Download
1 / 36
360 likes | 371 Views
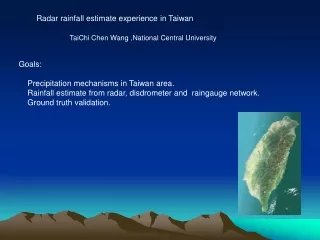
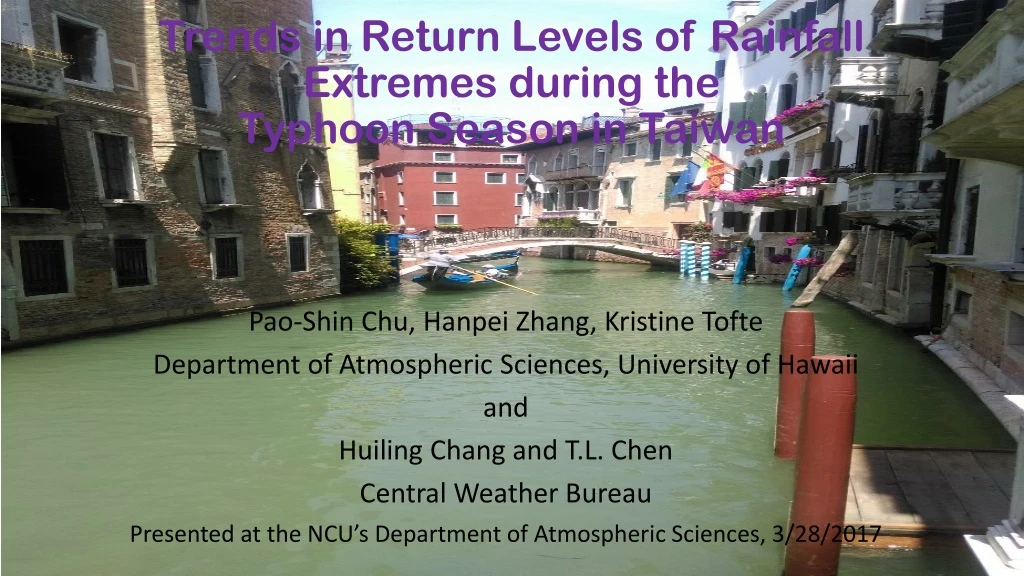
This study examines the trends in extreme rainfall events during the typhoon season in Taiwan using three different methods. It explores the definition of extreme rainfall events, the concept of return periods, and the use of extreme value analysis. The study also applies nonparametric Mann-Kendall test and Sen's method to detect trends in the data.

E N D
Trends in Return Levels of Rainfall Extremes during theTyphoon Season in Taiwan Pao-Shin Chu, Hanpei Zhang, Kristine Tofte Department of Atmospheric Sciences, University of Hawaii and Huiling Chang and T.L. Chen Central Weather Bureau Presented at the NCU’s Department of Atmospheric Sciences, 3/28/2017
Three different methods are commonly used to define extreme rainfall events • Daily precipitation with amounts above 2 (4) inches is defined as a heavy (very heavy) event - Karl et al. BAMS, 1996; Groisman et al., Climatic Change, 1999 • Daily precipitation values associated with the 90th (99th) percentile of the distribution as a heavy (very heavy) event – Groisman et al., BAMS, 2001 • Annual maximum daily precipitation values associated with 1-yr (20-yr) return periods as a heavy (very heavy) event – Kunkel et al., J. Climate, 1999; Groisman et al., BAMS, 2001; Zwiers and Kharin, J. Climate, 1998
Values are mean annual number of days with daily precipitation above 50.8 mm (heavy) and 101.6 mm (veryheavy) – Groisman, Knight, Karl 2001
Values are maximum daily precipitation (mm) associated with 90th (heavy) and 99th (very heavy) percentiles of Jan and July precipitation
Values are maximum daily precipitation (mm) associated with 1- (heavy) and 20-yr (very heavy) return periods.
What is the return period? • The return period, also known as recurrence interval, is interpreted to be the average time between occurrence of events of that magnitude or greater. It is commonly used for engineering design (e.g., urban drainage, flood control), risk analysis, environmental regulation, and flood insurance policy (flood hazard areas). • For example, a 100-yr rain storm has a 1% chance of being exceeded in any one year. However, there is no guarantee that a 100-yr event will occur within a 100-yr period. The probability of the 100-yr event occurring in a century is 0.634.
Extreme Value Analysis • Extreme value analysis (EVA) refers to the use of extreme value theory for analyzing data where interest is in rare, or low probability, events (e.g., annual maximum 24-hr precipitation) • The R package in2extRemes from UCAR provides a graphical user interface (GUI) or windows to functions from a ismev package, along with some additional functionality of its own.
Generalized Extreme Value (GEV) distribution ]1-1/]-1/}, 1+>0 Here there are three parameters: a location (or shift) parameter , a scale parameter , and a shape parameter . 1}. CDF Quantile function
For a stationary GEV, a cumulative distribution function given by (1) • where μ, σ and ξ are the location, scale, and shape parameter, respectively. • Estimates of the extreme quantiles, known as the return level zp, corresponding to the return period(τ)where pis the probability of occurrence (2) (3)
For the non-stationary GEV, (4) • The return level zp becomes (5) • It is now obvious that the location and scale parameters and the return level zp are also a function of time.
A positive slope of the location parameter (µ1 >0) will result in an increase in the return level, and vice versa. For a positive trend in the scale parameter (σ1 >0), the trend of return level will increase as p decreases, or return period τ increases. The opposite is true for a negative trend in the scale parameter.
When a positive trend in the location parameter is embedded with a positive trend of the scale parameter, then the trends of 20- and 100-yr return level will be steeper than that of the 2-yr return level (e.g., Taichung).
Zp (return level) is exceeded by the annual maximum in any particular year with probability p.
Climate Change Indices (WMO) for a standard comparison ≥ 50 mm R50 SDII, R50 (R25 for Hawaii), R5d, CDD
Nonparametric Mann-Kendall test and Sen’s method • Mann-Kendall test assumes that the time series dataset obeys the model: • For data pair xj and xk, where j>k, the sign is calculated: • The test statistic Sis calculated: • If n>10, the normal approximation statistics Y, which is based on S will be calculated. • Positive (negative) S or Y means positive (negative) trend;the significance of the trend is estimated based on the Y value using the table of the standard normal distribution cumulative probabilities.
Nonparametric Mann-Kendall test and Sen’s method • When using Sen’s method to estimate the slope of the trend, assume that f(t) in can be represented by: where Q is the slope to be estimated and B is a constant. • The slopes of all data pairs are calculated using where j>k. The median of all these slopes of data pairs is the Sen’s estimator of slope. • Mann-Kendall method tests whether the trend is increasing or decreasing and estimates the significance of the trend. • Sen’s method quantifies the slope of this trend. • Missing values are allowed in these two methods, and the data need not conform to any particular parametric distribution. Besides, the Sen’s method is robust against skewed distributions and outliers.
JASO, 1950-2010 Chu, Chen, Lin, 2014: Atm. Sci. Lett.
A distinct dry-wet condition during the typhoon season since 1950 Changes in plain stations are more consistent among the 3 precipitation-related indices (SDII, R50, R5d) but not so for stations in the CMR.
• An investigation of changes in return levels for the annual maximum 24-hr rainfall as induced by typhoons during the typhoon season (JASO) in Taiwan using a novel non-stationary GEV model • Upward trends of return levels in extreme rainfall are noted for a majority of stations since 1958 • The return-level threshold values are found to change with time considerably. For example, a rare storm with daily rainfall of 390 mm (20-yr return period) in Taichung in 1958 has become a rather common storm event (~13-yr return period) in 2013. Heavy rainfall events have become more frequent over the last 56 years. • El Niño events favor high extreme rainfall in the following typhoon season for northern and eastern Taiwan, while low extreme rainfall is expected for the CMR and western Taiwan. Summary for Part II • A non-stationary GEV model is recently developed to examine trends in return levels for annual maximum 1-day precipitation amounts since 1960. • The return-level threshold values are also found to change with time. For example, a rare storm with daily rainfall of 300 mm (20-yr return period) in 1960 has become a less rare event (4 to 5 yr return period) in 2009 on the Big Island.
Impact of this study • In the engineering design (e.g., urban drainage) and environmental regulations, return-period rainfall amounts are assumed to be constant at a given threshold level (e.g., 357 mm for a 100-yr return period). Because climate is changing, this assumption of stationary precipitation climatology should be revisited. • Need to modify existing facilities and safety preparation (e.g., reservoirs, dams, high-impact structures) as heavy rainfall and flooding are common in a warming climate
Chu et al., 2017: Trends in return levels of precipitation extremes during the typhoon season in Taiwan. In Prep. • Chen, Y.R., and P.-S. Chu, 2014: Trends in precipitation extremes and return levels in the Hawaiian Islands under a changing climate. Int. J. Climatol., 34, 3913-3925. • Chu, P.-S., D.J. Chen, and P.-L. Lin, 2014: Trends in precipitation extremes during the typhoon season in Taiwan over the last 60 years. Atmos. Sci. Lett., 15, 37-43. • Chu, P.-S., X. Zhao, Y. Ruan, and M. Grubbs, 2009: Extreme rainfall events in the Hawaiian Islands. J. Appl. Meteorol. Climatol., 48, 502-516.