Download

1 / 12
150 likes | 430 Views
BASIN PLAY Applied in Deep Water Oil Exploration Compared with Backscatter Seabed at Makassar Strait - Indonesia. Asia Geospatial Forum Regional Response to Global Challenges and Opportunities Kuala Lumpur – Malaysia, September 2013. Makassar Strait.

E N D
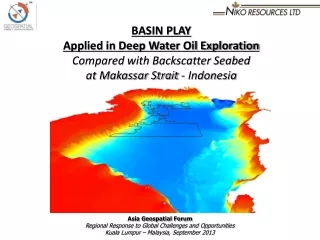
BASIN PLAY Applied in Deep Water Oil Exploration Compared with Backscatter Seabed at Makassar Strait - Indonesia Asia Geospatial Forum Regional Response to Global Challenges and Opportunities Kuala Lumpur – Malaysia, September 2013
Makassar Strait Makassar Strait separate Kalimantan (Borneo) island and Sulawesi (Celebes) island 200 km wide, the water depth vary between 0 - 2,500 m which the deepest area lies on northern part of the strait. Makassar Strait primary constructed by Kutei Basin, also called Kutai Basin, is the largest and deepest basin in Indonesia and estimated as the biggest hydrocarbon in Indonesia Celebes Sea Greater Tarakan Makassar Strait KUTAI BASIN Study Area Java Sea Pater Noster About 17% of PSC occupy in Makassar Strait is commercial area for oil and gas exploration. Niko has 3 PSC in Study Area, 2 operated block: South East Ganal I PSC & North Makassar Strait PSC; and 1 non operated block: North Ganal PSC
Fields and Well • Field • There are 113 fields in KuteiBasin • 31 fields in status Producing • 39 on phase Discovery • 13 in Developing level • Well • There are more than 6,000 well in KuteiBasin • Half of it drilled offshore • Only 220 of them lies at deep water zone. • Definition of deep water well is the process of drilling took more than 500 meter of water depth. The deep water well at Kutei Basin varies between 500 – 2,800 meter of water depth. Shalow Deep water Kutei Basin is surrounding by Gas and Oil Field which based on USGS assessment minimum undiscovered field size in this basin would be 1 million MMBO and 6 million MMSCFG (estimated at 2000).
Basin Analysis # Statistical calculation, merely using attribute table data and commonly use to examine value distribution and summarize data. The grap show Gendalo has biggest oil recovery than other three field whereas Gehem has biggest gas recovery. Oil Recovery (million mmbo) Gas Recovery million mmscfg GIS Database Well Log # Well Log of Net Reserve and Net Pay able to execute area pattern overview. Net Pay is volumetric estimation of hydrocarbon Resources. Net reserve are estimated remaining quantities of oil and natural gas and related substances anticipated to be recoverable from known accumulations.
Grid Interpolation Grid interpolation represents a prediction from several sample location for regional overview, where completeness values force high assumption that will bring different result which may be incorrect. Interpolation model that calculated Net Reserve and Net Pay in order to provide surface gridding that has taken from well logging both Pre and Post drill report. Net Pay Well : 9 location Resolution: 500 m Method : Kriging Universal type (linear with Quadratic drift) No Barrier Area Study cover in high Net Pay value (251 – 300) Kriging assumes that the distance or direction between sample points reflects a spatial correlation that can be used to explain variation in the surface.
Barrier and No Barrier (Net Reserve) Net Reserve Interpolation No Barrier Net Reserve Interpolation With Barrier (Structural Fault) Well : 10 location Resolution: 500 m Interpolation with barrier only available in Spline scheme.
Hydrology Analysis Bathymetry Flow Direction One of the keys to deriving hydrologic characteristics about a surface is the ability to determine the direction of flow from every cell in the raster which called Flow Direction. The Flow Accumulation calculates accumulated flow as the accumulated weight of all cells flowing into each downslope cell in the output raster. The output from Flow Direction will determine the connectivity of the flow direction in order to produce a flow accumulation dataset. Flow Accumulation
Structural Closure Streamlink and Watersheds Sink and Fill The workflow extended to map fetch and accumulation areas to identify structural topography ponding areas. GIS term is calculate sink where a cell that does not have a defined drainage value associated with it and Fill it which is used to remove any imperfections (sinks) in the digital elevation model. Measurements of both the areal closure and the distance from the apex to the lowest closing contour are typically incorporated in calculations of the estimated hydrocarbon content of a trap. Structural Closure
Prospect Area Prospect area (hydrology analysis) The closure must be considered as a barrier to the migration hydrocarbon in other words the passage from a porous and permeable facies to a fine-grained sediment exhibiting an injection pressure which is greater than the outward thrust exerted by the fluids. Thus the closure has obligatory to compare to the hardness of seabed rock composite.
Backscatter deStripe Most Prospect area (overlay hydrology analysis & backscatter) Backscatter can be used to determine bottom type, because different bottom types “scatter” sound energy differently. For example, a softer bottom such as mud will return a weaker signal than a harder bottom, like rock. The aim is to use this information for obtaining sediment properties (e.g., grain size) by analyzing the backscattered response. The simple word in describe Backscatter data is: Higher the value means harder the rock composite. Prospect Area (backscatter)
Drop Core Sample Planned Coring Location (Sample in order to have better data distribution) Planned Coring Location (Sample base on difference between backscatter and structural closure) Planned Coring Location (Sample base on difference between Net Pay - Net Reserve with backscatter - structural closure area) Coring Location (as additional information for further analysis)
THANK YOU Writer: Irvinia Arumsari iyenk@nikoresources.com +628159407354 Asia Geospatial Forum Regional Response to Global Challenges and Opportunities Kuala Lumpur – Malaysia, September 2013