Download
1 / 77
770 likes | 796 Views
SYSTEMS ANALYSIS & DESIGN. PHASE 3 SYSTEMS DESIGN Output Design. SDLC Phases. Phase 3: Systems Design. SDLC Phases. Phase 3: Systems Design Objectives Review general design requirements Complete output design, input design, file and database design, and system architecture. Chapter 6.

E N D
SYSTEMS ANALYSIS & DESIGN PHASE 3 SYSTEMS DESIGN Output Design
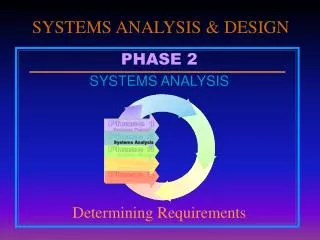
SDLC Phases Phase 3: Systems Design
SDLC Phases Phase 3: Systems Design • Objectives • Review general design requirements • Complete output design, input design, file and database design, and system architecture
Chapter 6 Output Design
Objectives • Explain the differences between logical and physical design • Discuss the objectives of systems design and provide guidelines for good design • List and describe the major activities of the systems design phase • Design and use appropriate codes in systems design and development
Objectives • Provide examples of types of output, including new technology-based methods of information delivery • Describe the classifications of output reports and explain the differences among them • Design effective printed reports that will meet user requirements
Objectives • Design screen reports that are easy to understand and use • Explain output control concepts and methods
Output design is the first of four chapters covering the systems design phase of the SDLC Chapter topics Overview of systems design Specific tasks in output design Output control and automated design tools Introduction
Logical design defines necessary system requirements and called an essential model Logical design specifies what must take place, not how it will be accomplished Physical design concerns how the system will be implemented Physical design describes specific components and system specifications Systems Design Overview
The relationship between analysis and design Logical and physical design are related closely Analysis should be completed before design Developers do not return from design to analysis work except in limited circumstances An important fact is overlooked Users have significant new needs Legal/governmental requirements change Unforeseen design issues or problems arise Systems Design Overview
Systems design activities All system components are related closely Must understand the entire logical design Systems Design Overview Click to see Figure 6-1
Systems design steps Review the system requirements Design the system Output Input Files and databases System architecture Present the systems design Systems Design Overview Click to see Figure 6-2
General Guidelines for SystemsDesign • Characteristics of a well-designed system • Effective • Satisfies defined requirements • Accepted by users • Reliable • Adequately handles errors (input, processing, hardware, or human mistakes) • Maintainable • Well-designed and flexible • Future modifications considered
Click to see Figure 6-3 General Guidelines for SystemsDesign • Design suggestions • Three categories of considerations • User considerations • Data considerations • Processing considerations
General Guidelines for SystemsDesign • User considerations • Make the system user-friendly • Consider where users receive output, or provide input to the system • Anticipate future needs • Users • Information system • Organization
Click to see Figure 6-4 General Guidelines for SystemsDesign • Data considerations • Enter data where and when it occurs • Verify data where it is input • Use automated data-entry methods • Control access for data entry • Report all entries or changes to critical values • Enter data into a system only once • Avoid data duplication
General Guidelines for SystemsDesign • Processing considerations • Use a modular (structured) design • Design modules that perform a single function
TRADEOFF • Good design: the flexibility issue • Hardcoded (fixed) values are inflexible • Users’ needs constantly change • Variable parameters can provide flexibility • Default values can be combined with user-defined parameters
A KEY QUESTION • What if users could design most of their own reports without IS assistance? • Would they request as many reports or the same types of reports? • What are the pros and cons of giving users total control over output?
General Guidelines for SystemsDesign • Design tradeoffs • Design goals often conflict with each other • Easier use might create more complex programming requirements • More flexibility might increase maintenance needed • Meeting one user’s requirements might make it harder to satisfy another’s needs • A major issue is quality versus cost
Click to see Figure 6-5 Designing and Using Codes • A code is a set of letters or numbers that represents an item of data • Codes serve many useful purposes • Save storage space and costs • Reduce data transmission time • Decrease data entry time • Can reveal or conceal information • Can reduce input errors
Click to see Figure 6-6 Designing and Using Codes • Types of coding • Sequence codes • Block sequence codes • Classification codes • Alphabetic codes • Mnemonic codes
Click to see Figure 6-7 Designing and Using Codes • Types of Coding • Sequence codes • Block sequence codes • Classification codes • Alphabetic codes • Mnemonic codes • Significant digit codes
Click to see Figure 6-8 Designing and Using Codes • Types of coding • Sequence codes • Block sequence codes • Classification codes • Alphabetic codes • Mnemonic codes • Significant digit codes • Derivation codes
Click to see Figure 6-9 Designing and Using Codes • Types of coding • Sequence codes • Block sequence codes • Classification codes • Alphabetic codes • Mnemonic codes • Significant digit codes • Derivation codes • Cipher codes • Action codes • Self-checking codes
Designing and Using Codes • Developing a code • Keep codes concise • Allow for expansion • Keep codes stable • Makes codes unique • Use sortable codes • Avoid confusing codes • Make codes meaningful • Use a code for a single purpose • Keep codes consistent
Introduction to Output Design • Users judge a system based on how well the output helps them perform their jobs • Output must be • Useful • Accurate • Understandable • Timely
Introduction to Output Design • Checklist for output design • Design process depends on • What is the purpose of the output? • Who or what wants this information, why is it needed, and how will it be used? • What information will be included? • What format should be used? • When will information be provided, and how often must it be updated? • Will simultaneous user access be required? • Are security or confidentiality issues involved that need to be considered?
Click to see Figure 6-10 Types of Output and InformationDelivery • Technology affects how people communicate and obtain information • Printers • Screens • Plotters • Audio output • E-mail • Links to Web pages • Automated facsimile system • Computer output microfilm (COM) • Other specialized devices
Types of Output and InformationDelivery • Printed output • Impact printers • Laser printers • Turnaround documents • Advantages/disadvantages of printed output • Many people prefer to work with paper • Paper is portable • Printed output is expensive to purchase, print, store, and dispose of • Printed output is outdated quickly
Types of Output and InformationDelivery • Screen output • The screen is the most familiar output device • Monitor • CRT (cathode ray tube) • LCD (liquid crystal display) • VDT (video display terminal) • Graphical output allows various special effects and user-friendly features • Screen output reflects immediate data changes
Click to see Figure 6-11 Types of Output and Information Delivery • Other types of information delivery • Audio output
Click to see Figure 6-12 Types of Output and Information Delivery • Other types of information delivery • Audio output • Automated facsimile and faxback systems • E-mail • Links to Web pages • Specialized forms of output
Designing Printed Reports • Reports can be classified by content • Detail reports • Exception reports • Summary reports • Reports also can be classified by distribution • Internal reports • External reports
Click to see Figure 6-13 Designing Printed Reports • Detail reports • Provide the most information • At least one line of output is produced for each record processed • Detail reports can be quite lengthy
Click to see Figure 6-14 Designing Printed Reports • Detail reports • Provide the most information • At least one line of output is produced for each record processed • Detail reports can be quite lengthy • Control-break reports • Use a control field • Must be sorted on the control field before printing • A control break occurs when the control field value changes
Click to see Figure 6-15 Designing Printed Reports • Exception reports • Show only records that meet a specific condition • Useful when particular information is required • Special parameter queries can be used to select only the records that meet specified conditions
Click to see Figure 6-16 Designing Printed Reports • Summary reports • Show only subtotals and totals • Useful for upper-level managers who do not require extensive detail
Designing Printed Reports • Internal reports • Distributed within the organization • Usually printed on stock paper • Blank, single ply, standard size • Less expensive • Can be used for many types of reports
Click to see Figure 6-17 Designing Printed Reports • External reports • Distributed outside the organization • Might include statements, invoices, or paychecks • Usually printed on special forms • More expensive than stock paper • Paper must be changed for each report printing job • Multi-part forms must be separated or decollated
Click to see Figure 6-18 Designing Printed Reports • External reports • Distributed outside the organization • Might include statements, invoices, or paychecks • Usually printed on special forms • More expensive than stock paper • Paper must be changed for each report printing job • Multi-part forms must be separated or decollated • Special forms can use preprinted graphics and logos
Click to see Figure 6-19 Designing Printed Reports • Usually printed on special forms • More expensive than stock paper • Paper must be changed for each report printing job • Multi-part forms must be separated or decollated • Special forms can use preprinted graphics and logos • Special applications, such as checks, require special forms
Click to see Figure 6-20 Click to see Figure 6-21 Designing Printed Reports • Designing the report • Most reports use graphical design • Choice of typefaces and scalable fonts • More design flexibility • Some reports are character-based • Printed on high-speed impact printers • Require printer spacing charts for layout and design
Click to see Figure 6-22 Designing Printed Reports • Stock paper reports • Page heading lines • Column heading lines • Column heading alignment(as shown in Figure 6-22)
Click to see Figure 6-28 Designing Printed Reports • Stock paper reports • Page heading lines • Column heading lines • Column heading alignment(as shown in Figure 6-22) • Spacing between columns • Order of data items on detail lines
Click to see Figure 6-29 Designing Printed Reports • Stock paper reports • Page heading lines • Column heading lines • Column heading alignment(as shown in Figure 6-22) • Spacing between columns • Order of data items on detail lines • Grouping detail lines
Click to see Figure 6-30 Designing Printed Reports • Stock paper reports • Page heading lines • Column heading lines • Column heading alignment(as shown in Figure 6-22) • Spacing between columns • Order of data items on detail lines • Grouping detail lines • Report footing • Improving a report design • Documenting a report design
Click to see Figure 6-31 Designing Printed Reports • Stock paper reports • Page heading lines • Column heading lines • Column heading alignment(as shown in Figure 6-22) • Spacing between columns • Order of data items on detail lines • Grouping detail lines • Report footing • Improving a report design • Documenting a report design • Design consistency
Click to see Figure 6-23 TRADEOFF • What can you do when there are not enough print positions on the page? • Several possible options • Abbreviate the column headings, with legend below • Print subtotals and totals(as shown in Figure 6-23)
Click to see Figure 6-24 TRADEOFF • What can you do when there are not enough print positions on the page? • Several possible options • Abbreviate the column headings, with legend below • Print subtotals and totals(as shown in Figure 6-23) • Alternate odd/even months(as shown in Figure 6-24)