Analysis of Serum TSH Levels and Body Weight in Leucine-Deficient Rats
50 likes | 69 Views
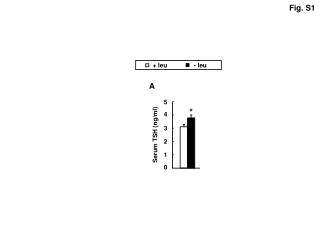
Investigate the impact of leucine deficiency on Serum TSH levels and body weight in rats. Results suggest a correlation between leucine intake, TSH levels, and weight changes in the experimental group.

Analysis of Serum TSH Levels and Body Weight in Leucine-Deficient Rats
E N D
Presentation Transcript
Fig. S1 + leu - leu A 5 * 4 3 Serum TSH (ng/ml) 2 1 0
Fig. S2 + leu - leu B A 4 26 * * 3 # 24 Average Body Weight (g) * 2 Average Food Intake (g) * 22 1 20 0 - - + + TRH Ab TRH Ab
Fig. S3 - leu/ + TRH Ab/ + T3 - leu/ + TRH Ab/ - T3 - leu/ - TRH Ab/ - T3 B A 4 * 26 # 25 3 # Average Body Weight (g) 24 2 Average Food Intake (g) 23 1 22 21 0
Fig. S4 + leu - leu B A 4 26 # * 3 * * 24 Average Body Weight (g) * 2 Average Food Intake (g) 22 1 0 20 - - + + Ad-shCREB Ad-shCREB
Fig. S5 - leu/ + shCREB/ + TRH - leu/ + shCREB/ - TRH - leu/ - shCREB/ - TRH B A 30 3.0 * # 20 2.0 Average Body Weight (g) Average Food Intake (g) 10 1.0 0 0


![[Fig. S1]](https://cdn3.slideserve.com/6448662/slide1-dt.jpg)


