Download
1 / 80
820 likes | 873 Views
Explore the impact of income inequality on subjective well-being and happiness, backed by research on physiological evidence, labor market outcomes, and health correlations.

E N D
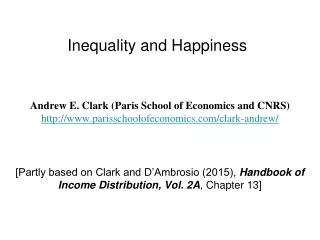
Inequality and Happiness Andrew E. Clark (Paris School of Economicsand CNRS) http://www.parisschoolofeconomics.com/clark-andrew/ [Partly based on Clark and D’Ambrosio (2015), Handbook of Income Distribution, Vol. 2A, Chapter 13]
This presentation is going to be about one thing that you think you know about - Income Inequality; And subjective well-being, or happiness – and that’s something you may know less about… so what is subjective well-being?
Satisfaction Questions The BHPS/Understanding Society Question: Here are some questions about how you feel about your life. Please tick the number which you feel best describes how dissatisfied or satisfied you are with the following aspects of your current situation. Your life overall [ 1 ] [ 2 ] [ 3 ] [ 4 ] [ 5 ] [ 6 ] [ 7 ] not satisfied at all completely satisfied This question is also asked about domains of life: e.g. health, income, house, partner ...
These are very often single-item measures (drives psychologists mad). But despite their simplicity, they do seem to be picking up essential information about the quality of individuals’ lives
Cross-Rater Validity If A is happy, then B is more likely to say that A is happy too: including A’s family, friends and the interviewer. This generalises to people you don’t know: respondents shown pictures or videos of others accurately identify whether the individual shown to them was happy, sad, jealous, and so on. 6
Physiological and Neurological Evidence There is a strong positive correlation between emotional expressions like smiling, and frowning, and answers to well-being questions In right-handed people, positive feelings are generally associated with more alpha power in the left prefrontal cortex (the dominant brain wave activity of awake adults are called alpha waves), and negative feelings with more alpha power in the right prefrontal cortex (approach and avoidance). Left-right brain asymmetry is shown to be associated with higher levels of positive affect, and with both hedonic and eudaimonic well-being 7
Brain asymmetry is also associated with physiological measures, such as cortisol and corticotropin releasing hormone (CRH) These are involved in response to stress, and with antibody production in response to influenza vaccine. Individuals with higher life satisfaction scores were less likely to catch a cold when exposed to a cold virus, and recovered faster if they did. 8
Predicting Health Outcomes The medical literature has found high correlations in the expected sense between low well-being scores and coronary heart disease, strokes, suicide and length of life. The Nun Study: happier nuns when they joined a convent in the 1930s (textual analysis of biography) live longer. Best predictor of life expectancy in ELSA is current enjoyment with day-to-day activities. 9
Predicting Labour Market Outcomes In the labour market, job satisfaction at time t is a strong predictor of job quits (even when controlling for wages, hours of work and other standard individual and job variables). And effort at work. 10
In general, SWB scores are “well-behaved” Variables often associated with higher SWB: being in employment having good health being married being female having higher income having children (?) Mid-life crisis: being young; or being old 11
So subjective well-being measures, make sense, and uncover the relationships that we “think” they should. What is then the relationship between income inequality and happiness?
1) A very simple model of inequality and happiness produces a simple answer: • Individual well-being is concave in income (an extra $1000 matters less for someone with $200 000 than for someone with $40 000) • The “social welfare function” (our overall index for how society is doing) rises with the sum of individual well-being Then greater income inequality reduces social welfare (as we are taking income away from those who value it more)
Game over! But can it really be that easy?
Inequality is a social phenomenon: it refers to disparities in incomes between individuals (i.e. there is income inequality when some individuals receive different incomes than do others).
2) We can have a dispassionate normative opinion about any distribution of income, which is independent of our own position in that distribution. • I can have an opinion about income distribution in NYC • You can have an opinion about income distribution in Brazil • We can both have an opinion about the distribution of income in 19th Century Germany.
These “gut feelings” may well lead us to say that there is too much inequality too… Over and above our (correct) fixation on the diminishing marginal utility of income, we can then still conclude that inequality reduces subjective well-being, right? Not finished yet though…
3) Most of the time, we also appear in the income distributions that are changing. So: any change in incomes will affect not only my own income, but also the gaps between my income and the income of others in my society (to whom I compare) – my reference group. This brings about a passionate response, as it were.
Changing income inequality affects not only how much income I receive (my absolute income), but also how much richer and poorer I am compared to others. In this sense, we can think of the utility from income, as depending on not only my income but also the income of my reference group: V = V(Yi, Yi, ref)
We think in general that: V = V(Yi, Yi, ref) + - An increase in income inequality that makes you richer (but not me) then makes merelatively poor (relative to you) and reduces my well-being But an increase in income inequality that makes you richer (but not me) makes you relatively rich (relative to me) and increases your well-being
Any change in the distribution of income will have many, many effects on our incomes relative to others, depending on: • the change in how much we earn; • the change in how much others earn; • to whom we compare (everyone? Rich? Poor?)
Let’s take all of this at face value. The correlation between inequality and happiness will be 1) Negative via own income (concavity) 2) Negative? (but who knows) via normative evaluation (this depends on your views of fairness) 3) Ambiguous via comparisons to others, as it depends how your own income changes relative to that of your reference group.
The jury really is out. The main culprit so far for this ambiguity is income comparisons: inequality implies changes in both absolute income, and relative income. Life would be so much easier without the latter So how do we know that income comparisons matter for individual happiness?
Happiness approach: Luttmer (2005) US National Survey of Families and Households
Clark (1996). BHPS (UK): very local comparisons Estimated only on couples where both partners are in work. Includes other standard control variables.
Subjective Well-Being Measures are not the only possible way of showing comparison effects. The Leyden approach. Invert the question: Who needs more money to have a good life? Initiated by Bernard Van Praag. Ask individuals to assign income levels (per period) to six or nine different verbal labels (such as "excellent“,"sufficient" and "bad").
Van Praag can then estimate for each individual a lognormal “Welfare Function of Income” (the jump in income required to go from one label to another becomes increasingly large). The resulting individual estimated means () and variances () – there is one curve for each person – were then used as dependent variables in regressions to show which types of individuals require a higher level of income to be satisfied, and which individuals have valuations that are more sensitive to changes in income. Those with higher reference group income, and who had earned more in the past, had higher values of .
Those with higher values of μ use lower verbal well-being labels at any given level of income
2) Ask people. Preference for rising income profiles, and preferences for lower absolute incomes: • A: Your current yearly income is $50,000; others earn $25,000. • B: Your current yearly income is $100,000; others earn $200,000. Individuals have a marked preference for A over B. Positionality differs according to the domain. In Alpizar et al. (2005) this is stronger for cars and housing, and weaker for vacations and insurance.
3) Experimental. • Ultimatum game: responders frequently rejecting offers that are under 25% of the total sum; as such the the vast majority of offers are between 40% and 50% of the sum. • Dictator game: non-strategic. The survey of 616 such experiments in Engel (2011) concludes that dictators give on average 28.35% of the sum of money to be divided. This may inform us of normative views of income distributions rather.
Zizzo and Oswald (2001) report the results of an experiment whereby subjects can pay to burn each other’s money. A majority of subjects chose to do so, even though it costs them real earnings. The average subject had half of her earnings burnt, and richer subjects were burnt more often. d) McBride (2010) shows how comparisons to income expectations matter, in a matching pennies game, where individuals play against computers. The computer chooses heads or tails according to (known) probability distributions (for example 80% heads, 20% tails). After each round of playing, individuals report their satisfaction with the outcome.
Introduces social comparisons in some of the treatments (by telling the individual the outcomes of the other players). Income expectation effect identified by varying the heads and tails probabilities played by the computer. Each subject has five pennies to play. When paired with a 80% heads, 20% tails computer, the best strategy is to always play heads, which gives an expected payoff of four pennies. When paired with a 65% heads, 35% tails computer, the best strategy is still to always play heads, but now the expected payoff is only 3.25 pennies. Results: satisfaction is i) higher the more one wins ii) lower the more others win iii) lower the higher was the aspiration level.
4) Natural ExperimentsCard et al. (2012): the revelation of information on others' earnings. The natural experiment here is a court decision that made the salary of any California state employee public knowledge. A local newspaper set up a website making it easy to find this information. Following this website launch, Card et al. informed a random subset of employees at three UC campuses about the site.
Some days later, all employees on the three campuses were surveyed. Compare the treatment group (informed about the website) to others to reveal the impact of information on others' salaries. The reference group was defined here as co-workers in the same occupation group (faculty vs. staff) and administrative unit in the university.
The survey found lower job satisfaction for those with pay below the reference group median and a greater intention to look for a new job. The effect on both for those who were relatively well-paid was insignificant. There is some evidence of an actual quitting effect on those who were found to be in the bottom earnings quartile in the reference group.
This is not a banal effect of “low pay leads to lower satisfaction and greater quits”.Pay in the treated and untreated groups is the same. The treated group are instead more likely to find out that they are relatively badly-paid
5) Neuro. Fließbach, K., Weber, B., Trautner, P., Dohmen, T., Sunde, U., Elger, C., & Falk, A. (2007). "Social comparison affects reward-related brain activity in the human ventral striatum". Science, 318, 1305-1308.
Payoffs vary according to whether the individual gets the task right, and also randomly when the task is correct
Brain activity measured via BOLD blood flow in various voxels. Particular attention paid to the ventral striatum: the “neural circuitry of reward” This kind of striatal activity has been shown to predict both hedonic outcomes (subjective well-being) and physiological outcomes (cortisol output: the body’s response to stress)
Brain activation depends on relative income: compare C6, C8 and C11 (where the individual receives 60 Euros), and C7 to C9.
What do we know about normative evaluations of inequality? What do people say about the overall degree of income inequality, without making any comparisons to others?
Experimental attitudes to inequality 1) Trade off level of income to inequality of income: • The “hypothetical grandchild”; • The leaky-bucket.
The well-being of imaginary grandchilden in alternative societies which are characterized by different uniform income distributions (e.g., Society A ranges from 10,000 to 50,000 Swedish kroner, but Society B from 19,400 to 38,800 Swedish kroner). Expected income higher in Society A Choose the society that is best for your grandchild. Respondents were also told that they did not know their grandchild’s position in the income distribution, and that they should place equal probability on all outcomes.
The more inequality-averse the individual is, the more they are willing to trade-off expected income in order to achieve a more equal income distribution. Individuals do exhibit a considerable amount of inequality aversion in these experiments
The “leaky-bucket” experiment. Students were asked to indicate the amount of ‘lost money’ that they were willing to accept for a transfer of money from a richer to a poorer individual, loss due to administrative costs. The median value of inequality aversion was much lower than the existing estimates from hypothetical grandchildren. However, the circumstances of the two experiments are very different, making a clear comparison of the results rather difficult.
2) Do people even agree with the basic axioms of inequality measurement? Test the Pigou-Dalton transfer principle. The seminal book is this area is Amiel and Cowell (1999). Verbal experiment: “Suppose we transfer income from a person who has more income to a person who has less, without changing anyone else’s income. After the transfer the person who formerly has more still has more.” 60% agree that this reduces inequality.
Numerical experiment: Consider two income distributions: Society A = (l, 4, 7, 10, 13) Society B = (l, 5, 6, 10, 13). Only 1/3 agree that Society B is more equal than Society A (even though the “transfer” between the two corresponds to the Pigou-Dalton principle) Individuals think of falling income inequality in Robin Hood terms (and perhaps also of rising inequality in Sheriff of Nottingham terms)
What is then the sum total of own income, income comparisons, and the normative evidence? Inequality and well-being There are many equations estimated such as: