Download
1 / 562
5.62k likes | 5.7k Views
Explore demographic shifts, age distribution, and arrest rates for different offenses among juveniles in the Coastal Bend region and state from 2000 to 2004 based on data from the US Census and Texas Department of Public Safety.

E N D
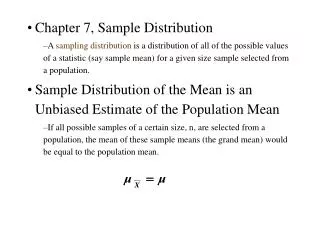
Coastal Bend and State Population% Distribution by Age Groups 2000 5.1% Fewer in Working Age Source: US Census
Coastal Bend and State Population% Distribution by Age Groups 2004 Source: US Census
2004 Regional Population by Age Source: US Census
2004 Regional Elderly Population Source: US Census
2004 Regional Male / Female Population Source: US Census
2004 Regional Racial & Cultural Diversity Source: US Census
Population Percentage Change from 1990 to 2000 Source: U.S. Census
Population Percentage Change from 2000 to 2004 Source: U.S. Census
Proportion of Population 12 and Under 2000 Source: U.S. Census
Proportion of Population 12 and Under 2004 Source: U.S. Census
Proportion of Population Youth age 13 – 17 years 2000 Source: U.S. Census
Proportion of Population Youth age 13 – 17 years 2004 Source: U.S. Census
Proportion of Population Adults 18 & Older 2000 Source: U.S. Census
Proportion of Population Adults 18 & Older 2004 Source: U.S. Census
Proportion of Population 65 Years of Age or Older 2000 Source: U.S. Census
Proportion of Population 65 Years of Age or Older 2004 Source: U.S. Census
Rate - Males 2000 Source: U.S. Census
Rate - Males 2004 Source: U.S. Census
Rate - Female 2000 Source: U.S. Census
Rate - Female 2004 Source: U.S. Census
Rate – White including Hispanics 2000 Source: U.S. Census
Rate – White including Hispanics 2004 Source: U.S. Census
Rate – Hispanics 2000 Source: U.S. Census
Rate – Hispanics 2004 Source: U.S. Census
Rate – African American 2000 Source: U.S. Census
Rate – African American 2004 Source: U.S. Census
Rate – Other 2000 Source: U.S. Census
Rate – Other 2004 Source: U.S. Census
Alcohol Offenses 2000Arrest Rate Per 1,000 Juveniles Source: Tx. Dept of Public Safety
Alcohol Offenses 2001Arrest Rate Per 1,000 Juveniles Source: Tx. Dept of Public Safety
Alcohol Offenses 2002Arrest Rate Per 1,000 Juveniles Source: Tx. Dept of Public Safety
Alcohol Offenses 2003Arrest Rate Per 1,000 Juveniles Source: Tx. Dept of Public Safety
Alcohol Offenses 2004Arrest Rate Per 1,000 Juveniles Source: Tx. Dept of Public Safety
Violent Offenses 2000Arrest Rate Per 1,000 Juveniles Source: Tx. Dept of Public Safety
Violent Offenses 2001Arrest Rate Per 1,000 Juveniles Source: Tx. Dept of Public Safety
Violent Offenses 2002Arrest Rate Per 1,000 Juveniles Source: Tx. Dept of Public Safety
Violent Offenses 2003Arrest Rate Per 1,000 Juveniles Source: Tx. Dept of Public Safety
Violent Offenses 2004Arrest Rate Per 1,000 Juveniles Source: Tx. Dept of Public Safety
Drug Offenses 2000Arrest Rate Per 1,000 Juveniles Source: Tx. Dept of Public Safety
Drug Offenses 2001Arrest Rate Per 1,000 Juveniles Source: Tx. Dept of Public Safety
Drug Offenses 2002Arrest Rate Per 1,000 Juveniles Source: Tx. Dept of Public Safety
Drug Offenses 2003Arrest Rate Per 1,000 Juveniles Source: Tx. Dept of Public Safety
Drug Offenses 2004Arrest Rate Per 1,000 Juveniles Source: Tx. Dept of Public Safety
Property Offenses 2000Arrest Rate Per 1,000 juveniles Source: Tx. Dept of Public Safety
Property Offenses 2001Arrest Rate Per 1,000 Juveniles Source: Tx. Dept of Public Safety
Property Offenses 2002Arrest Rate Per 1,000 juveniles Source: Tx. Dept of Public Safety
Property Offenses 2003Arrest Rate Per 1,000 juveniles Source: Tx. Dept of Public Safety
Property Offenses 2004Arrest Rate Per 1,000 juveniles Source: Tx. Dept of Public Safety
Runaway 2000Arrest Rate Per 1,000 Juveniles Source: Tx. Dept of Public Safety