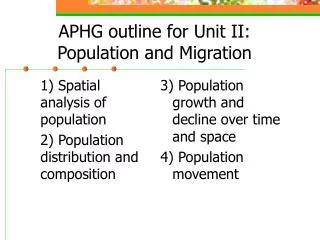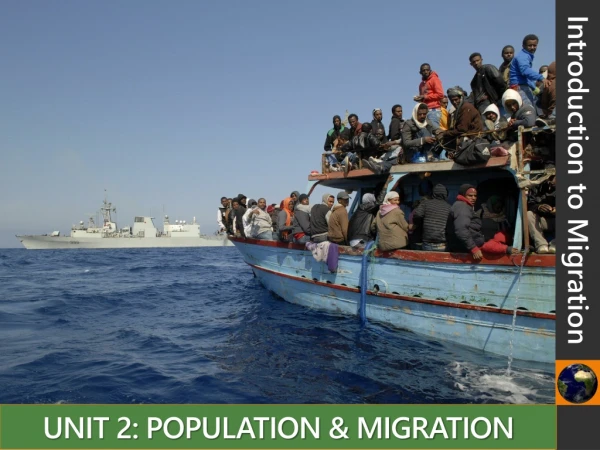
Unit 2: Population and Migration
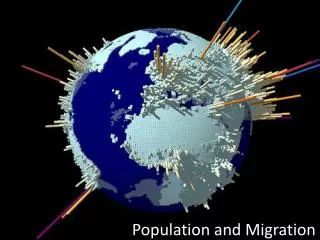
Unit 2: Population and Migration. Population. Part 1: Where is everyone?. What is population distribution?. “ Population distributions are descriptions of locations on the Earth’s surface where individuals or groups live.”.


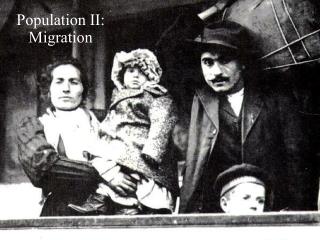
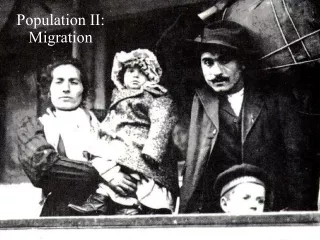
Unit 2: Population and Migration
E N D
Presentation Transcript
“Population distributions are descriptions of locations on the Earth’s surface where individuals or groups live.”
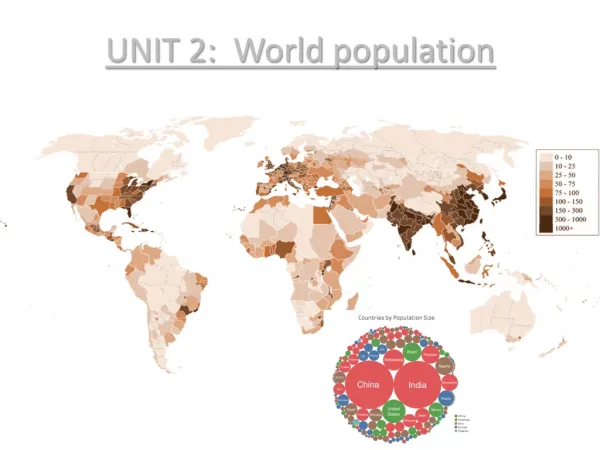
Two-thirds of the World’s Population is concentrated in four specific areas.
“Ecumene is the portion of the Earth’s surface occupied by permanent human settlement.”
“Population Density is the number of people occupying an area of land.”
What inferences can you make by looking at countries with a high percentage of arable land but a low agricultural density? What inferences can you make about a country with a high physiological density but a low arithmetic density?
“You can measure population change through the Crude Birth Rate, the Crude Death Rate, and the Natural Increase Rate.”
The Crude Birth Rate (CBR) is the total number of live births a year for every 1,000 people alive in the society.
The Crude Death Rate (CDR) is the total number of deathsa year for every 1,000 people alive in the society.
The Natural Increase Rate (NIR) is the percentage by which a population grows in a year.
The Total Fertility Rate(TFR) is the average number of children a woman will have during her childbearing years.
The Infant Mortality Rate (IMR) is the annual number of deaths of infants under 1 year compared with total live births.
Life Expectancy measures the average number of years a newborn can expect to live at current morbidity levels.
“A population pyramid is a graphical illustration that shows the distribution of various age groups as well as the sex ratio, the number of males per hundred females and the dependency ratio, the number of people who are too old or too young to work.
“A model attempts toexplain or demonstrate why something exists the way it does. “
“The demographic transition model explains the transition from high birth and death rates to low birth and death rates as a country develops from a pre-industrial to an industrialized economic system.
Stage 1: Low Growth • People depended on hunting and gathering for food. • Most of human history spent during this stage. • The NIR is essentially zero. • There is no country still in stage 1.
Stage 2: High Growth • Brought about by the Industrial Revolution. • CDR Plummets while the CBR remains the same as in stage 1. • Allowed to spread to LDRs by the medical revolution (20th century)
Stage 3: Moderate Growth • Brought about by cultural changes. • Characterized by a sudden drop in the CBR. • There is still growth but not as fast as in Stage 2
Stage 3: Moderate Growth • The CBR = CDR • Zero Population Growth • Low TFR
Stage 5: Negative Growth • Though not official, some say that there is a Stage Five. • In stage five, CDR is greater than CBR largely because of an aging population. • The NIR is below Zero. • Much of Europe is entering this stage.